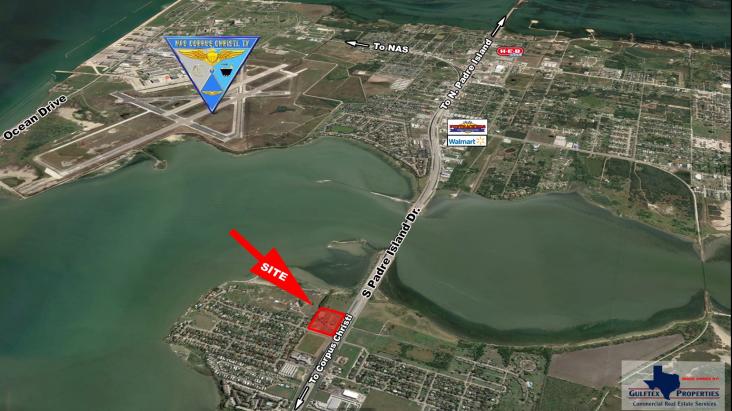
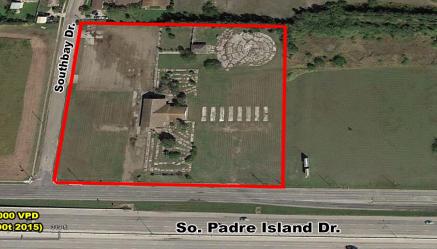
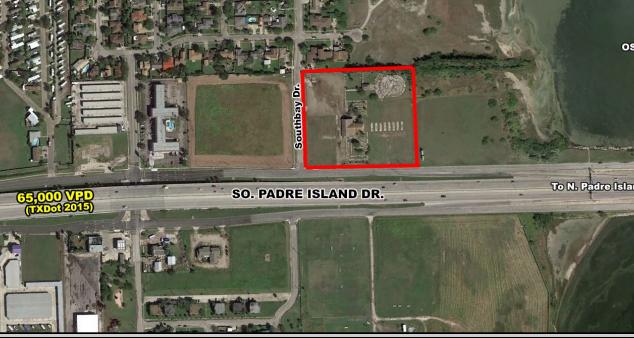
1-Mile | 3-Miles | 5-Miles | ||
---|---|---|---|---|
Total Population | 10,464 | 67,780 | 155,124 | |
Population Median Age | 35 | 34 | 36 | |
Population by Age | 0-9 Yrs | 1339 (12%) | 8807 (12%) | 21864 (14%) |
10-19 Yrs | 1476 (14%) | 10950 (16%) | 22435 (14%) | |
20-29 Yrs | 2009 (19%) | 13218 (19%) | 25669 (16%) | |
30-39 Yrs | 1593 (15%) | 10011 (14%) | 22861 (14%) | |
40-49 Yrs | 1035 (9%) | 6675 (9%) | 17504 (11%) | |
50-59 Yrs | 1185 (11%) | 7323 (10%) | 16999 (10%) | |
60-69 Yrs | 1024 (9%) | 6031 (8%) | 15532 (10%) | |
70+ Yrs | 804 (7%) | 4765 (7%) | 12259 (7%) | |
Median HH Income | $48,437 | $55,435 | $60,256 | |
Total Household Income | < 24K | 1301 (26%) | 6382 (23%) | 11757 (19%) |
25-49K | 1216 (24%) | 5800 (21%) | 13045 (21%) | |
50-74K | 842 (17%) | 4754 (17%) | 10883 (18%) | |
75-99K | 1121 (22%) | 4519 (16%) | 9215 (15%) | |
100-199K | 351 (7%) | 4238 (15%) | 11769 (19%) | |
200K+ | 64 (1%) | 899 (3%) | 2636 (4%) | |
Highest Education Level | No Diploma | 908 | 4115 | 9569 |
Diploma or GED | 1788 | 11337 | 26689 | |
Some College | 1515 | 9835 | 24716 | |
Assoc. Degree | 596 | 4259 | 9303 | |
Bachelors Degree | 1489 | 8365 | 18379 | |
Higher Degree | 529 | 3610 | 9749 | |
Total Housing Units | 5,148 | 28,438 | 64,980 | |
--Owner-Occupied | 1,851 | 12,622 | 30,830 | |
--Renter-Occupied | 3,044 | 13,970 | 28,476 | |
Owner-Occupied Values | < 100K | 568 | 2957 | 6309 |
100-199K | 931 | 6607 | 14566 | |
200-299K | 276 | 2107 | 6896 | |
300-399K | 4 | 447 | 1454 | |
400-499K | 65 | 163 | 476 | |
500K+ | 8 | 342 | 1128 | |
Total Working Age Population | 8,239 | 54,083 | 121,784 | |
In Work Force | 5,284 | 34,798 | 79,589 | |
Not In Work Force | 2,956 | 19,285 | 42,195 | |
Workforce Employed | 5,072 | 31,823 | 74,339 | |
Workforce Unemployed | 185 | 2,178 | 3,813 | |
Civlian Workforce | 5,257 | 34,001 | 78,152 | |
Military Workforce | 26 | 797 | 1,437 | |
Total Households | 4,895 | 26,593 | 59,305 | |
Family Households | 2,573 | 15,654 | 37,055 | |
Non-Family Households | 2,322 | 10,939 | 22,250 | |
Married Couple | 1,640 | 10,459 | 25,272 | |
Other Family | 933 | 5,195 | 11,783 | |
Married w/Child | 347 | 3,677 | 9,935 | |
Single Male w/Child | 110 | 700 | 2,071 | |
Single Female w/Child | 431 | 2,226 | 4,529 |
Population Change Last Two Decades - Plus Projection
2000 | % | 2010 | % | 2020 | % | 2030 | |
---|---|---|---|---|---|---|---|
Texas | 20,851,820 | +21 | 25,145,561 | +18 | 29,677,668 | +18 | 34,894,452 |
Kleberg County | 31,549 | +2 | 32,061 | -3 | 30,987 | -2 | 30,486 |
Nueces County | 313,645 | +8 | 340,223 | +13 | 383,718 | +12 | 429,517 |
Total Working Age Population:
Total Households:
Total Working Age Population:
Total Households:
Total Working Age Population:
Total Households: