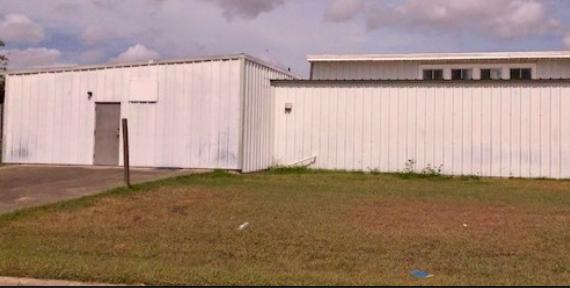
Industrial Properties
6702 Ranger Avenue Corpus Christi, TX 78415
6702 Ranger Avenue Corpus Christi, TX 78415
Details & Description
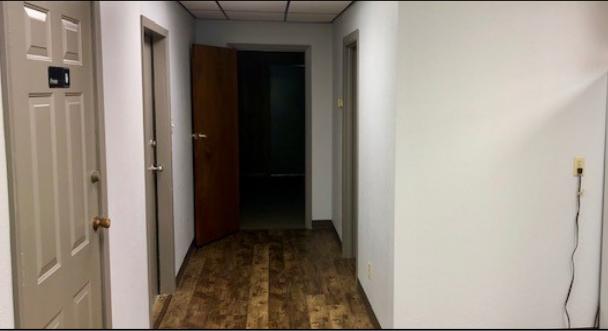
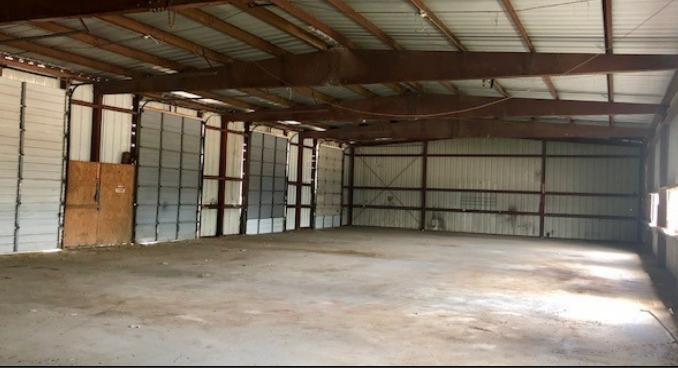
Additional Photos

Listing Agents

Jim Baxter
O: 361-992-9700
jim@gulftex.com
O: 361-992-9700
jim@gulftex.com
While we strive to provide the most accurate information, all listing information, and demographic data, is provided by third-parties. As such, MyEListing will not be responsible for the accuracy of the information. It is strongly recommended that you verify all information with the listing agent, and any relevant agencies, prior to making any decisions.


