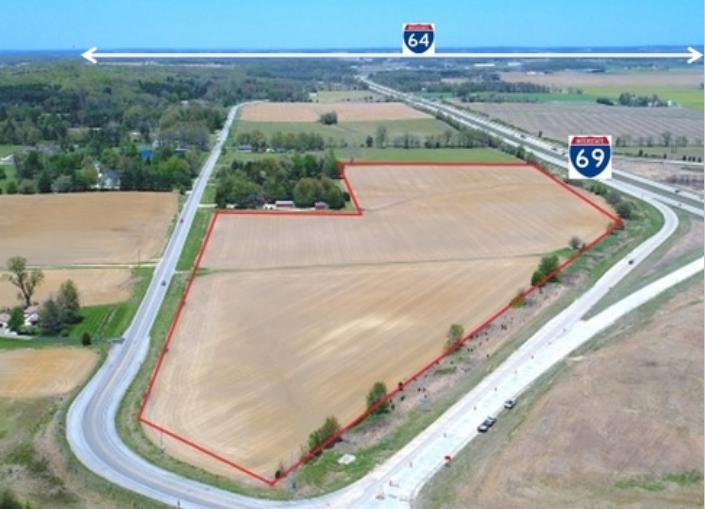
1-Mile | 3-Miles | 5-Miles | ||
---|---|---|---|---|
Total Population | 262 | 4,167 | 12,841 | |
Population Median Age | 39 | 37 | 38 | |
Population by Age | 0-9 Yrs | 27 (10%) | 534 (12%) | 1705 (13%) |
10-19 Yrs | 42 (16%) | 712 (17%) | 2068 (16%) | |
20-29 Yrs | 33 (12%) | 404 (9%) | 1134 (8%) | |
30-39 Yrs | 29 (11%) | 626 (15%) | 1865 (14%) | |
40-49 Yrs | 33 (12%) | 609 (14%) | 1886 (14%) | |
50-59 Yrs | 44 (16%) | 561 (13%) | 1669 (12%) | |
60-69 Yrs | 26 (9%) | 388 (9%) | 1449 (11%) | |
70+ Yrs | 27 (10%) | 332 (7%) | 1064 (8%) | |
Median HH Income | $83,356 | $81,489 | $85,808 | |
Total Household Income | < 24K | 11 (10%) | 122 (7%) | 352 (7%) |
25-49K | 13 (12%) | 217 (14%) | 639 (13%) | |
50-74K | 17 (16%) | 324 (21%) | 966 (20%) | |
75-99K | 28 (27%) | 388 (25%) | 955 (20%) | |
100-199K | 23 (22%) | 392 (25%) | 1468 (30%) | |
200K+ | 9 (8%) | 84 (5%) | 359 (7%) | |
Highest Education Level | No Diploma | 12 | 150 | 407 |
Diploma or GED | 51 | 753 | 2048 | |
Some College | 42 | 643 | 1808 | |
Assoc. Degree | 20 | 326 | 1038 | |
Bachelors Degree | 35 | 621 | 2128 | |
Higher Degree | 16 | 248 | 1155 | |
Total Housing Units | 106 | 1,596 | 4,929 | |
--Owner-Occupied | 93 | 1,403 | 4,373 | |
--Renter-Occupied | 8 | 124 | 366 | |
Owner-Occupied Values | < 100K | 18 | 175 | 349 |
100-199K | 31 | 732 | 2071 | |
200-299K | 24 | 256 | 920 | |
300-399K | 12 | 158 | 576 | |
400-499K | 6 | 42 | 186 | |
500K+ | 4 | 41 | 270 | |
Total Working Age Population | 212 | 3,162 | 9,698 | |
In Work Force | 139 | 2,223 | 6,903 | |
Not In Work Force | 73 | 939 | 2,795 | |
Workforce Employed | 135 | 2,136 | 6,697 | |
Workforce Unemployed | 4 | 83 | 185 | |
Civlian Workforce | 139 | 2,219 | 6,881 | |
Military Workforce | 0 | 3 | 21 | |
Total Households | 101 | 1,527 | 4,739 | |
Family Households | 74 | 1,231 | 3,782 | |
Non-Family Households | 27 | 296 | 957 | |
Married Couple | 62 | 971 | 3,089 | |
Other Family | 13 | 260 | 692 | |
Married w/Child | 28 | 466 | 1,395 | |
Single Male w/Child | 4 | 77 | 178 | |
Single Female w/Child | 6 | 111 | 270 |
Population Change Last Two Decades - Plus Projection
2000 | % | 2010 | % | 2020 | % | 2030 | |
---|---|---|---|---|---|---|---|
Indiana | 6,080,485 | +7 | 6,483,802 | +4 | 6,738,573 | +4 | 7,014,880 |
Gibson County | 32,500 | +3 | 33,503 | +2 | 34,077 | +2 | 34,783 |
Vanderburgh County | 171,922 | +5 | 179,703 | +3 | 184,440 | +3 | 189,441 |
Warrick County | 52,383 | +14 | 59,689 | +7 | 63,818 | +6 | 67,958 |
Total Working Age Population:
Total Households:
Total Working Age Population:
Total Households:
Total Working Age Population:
Total Households: