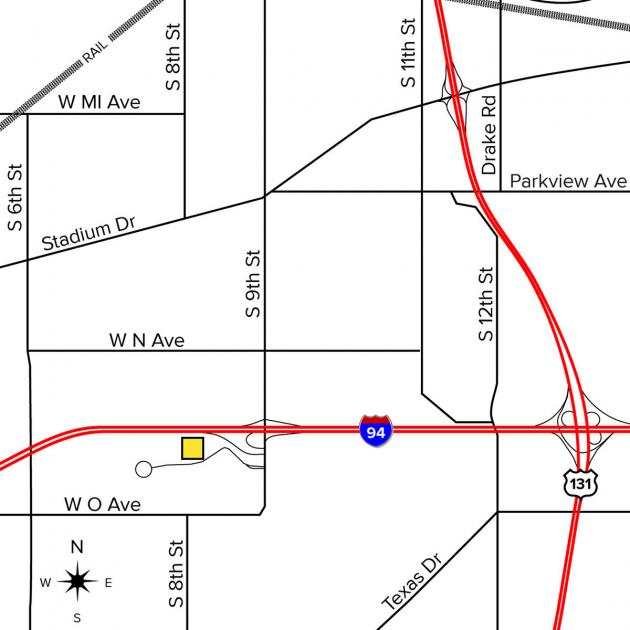
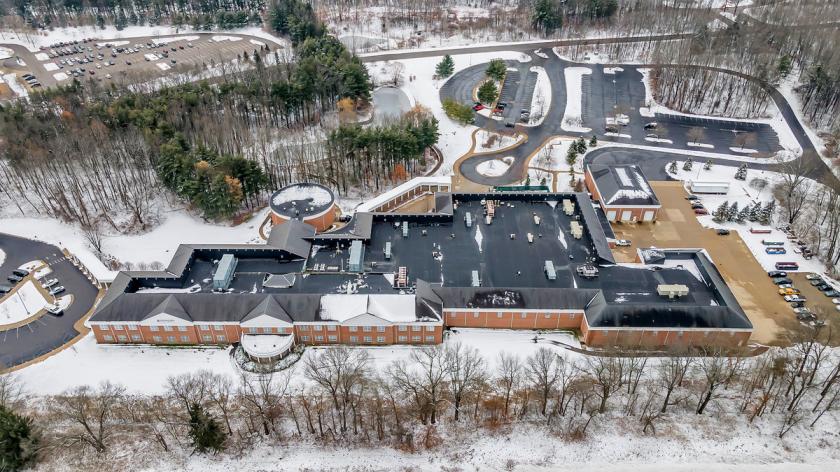
1-Mile | 3-Miles | 5-Miles | ||
---|---|---|---|---|
Total Population | 1,932 | 27,969 | 90,840 | |
Population Median Age | 41 | 39 | 37 | |
Population by Age | 0-9 Yrs | 279 (14%) | 3679 (13%) | 10262 (11%) |
10-19 Yrs | 206 (10%) | 3503 (12%) | 12297 (13%) | |
20-29 Yrs | 246 (12%) | 3601 (12%) | 21061 (23%) | |
30-39 Yrs | 212 (10%) | 3400 (12%) | 10032 (11%) | |
40-49 Yrs | 230 (11%) | 3668 (13%) | 10009 (11%) | |
50-59 Yrs | 289 (14%) | 3438 (12%) | 9112 (10%) | |
60-69 Yrs | 158 (8%) | 3194 (11%) | 9268 (10%) | |
70+ Yrs | 313 (16%) | 3486 (12%) | 8800 (9%) | |
Median HH Income | $81,924 | $74,764 | $59,025 | |
Total Household Income | < 24K | 79 (10%) | 1425 (12%) | 7281 (20%) |
25-49K | 169 (22%) | 2602 (23%) | 8545 (23%) | |
50-74K | 112 (14%) | 1569 (14%) | 5833 (16%) | |
75-99K | 76 (9%) | 1396 (12%) | 4037 (11%) | |
100-199K | 236 (30%) | 3106 (27%) | 8033 (22%) | |
200K+ | 90 (11%) | 1067 (9%) | 2525 (6%) | |
Highest Education Level | No Diploma | 37 | 803 | 2263 |
Diploma or GED | 225 | 3097 | 9082 | |
Some College | 352 | 3664 | 10649 | |
Assoc. Degree | 86 | 1463 | 4294 | |
Bachelors Degree | 370 | 5477 | 15146 | |
Higher Degree | 259 | 4336 | 12033 | |
Total Housing Units | 784 | 11,861 | 39,390 | |
--Owner-Occupied | 607 | 7,801 | 21,062 | |
--Renter-Occupied | 154 | 3,365 | 15,193 | |
Owner-Occupied Values | < 100K | 71 | 977 | 2977 |
100-199K | 143 | 2100 | 7737 | |
200-299K | 149 | 2577 | 5806 | |
300-399K | 74 | 810 | 1938 | |
400-499K | 69 | 653 | 1310 | |
500K+ | 102 | 683 | 1293 | |
Total Working Age Population | 1,504 | 21,945 | 74,381 | |
In Work Force | 886 | 14,349 | 50,447 | |
Not In Work Force | 618 | 7,596 | 23,935 | |
Workforce Employed | 865 | 13,591 | 47,631 | |
Workforce Unemployed | 21 | 726 | 2,743 | |
Civlian Workforce | 886 | 14,317 | 50,374 | |
Military Workforce | 0 | 32 | 73 | |
Total Households | 762 | 11,166 | 36,255 | |
Family Households | 567 | 7,543 | 20,689 | |
Non-Family Households | 195 | 3,623 | 15,566 | |
Married Couple | 502 | 6,232 | 16,230 | |
Other Family | 64 | 1,311 | 4,459 | |
Married w/Child | 204 | 2,756 | 6,624 | |
Single Male w/Child | 22 | 253 | 769 | |
Single Female w/Child | 18 | 501 | 1,932 |
Population Change Last Two Decades - Plus Projection
2000 | % | 2010 | % | 2020 | % | 2030 | |
---|---|---|---|---|---|---|---|
Michigan | 9,938,444 | -1 | 9,883,640 | +1 | 10,023,423 | +4 | 10,424,510 |
Kalamazoo County | 238,603 | +5 | 250,331 | +7 | 267,738 | +8 | 290,091 |
Van Buren County | 76,263 | 0 | 76,258 | -1 | 75,546 | +2 | 77,172 |
Total Working Age Population:
Total Households:
Total Working Age Population:
Total Households:
Total Working Age Population:
Total Households: