Industrial Properties
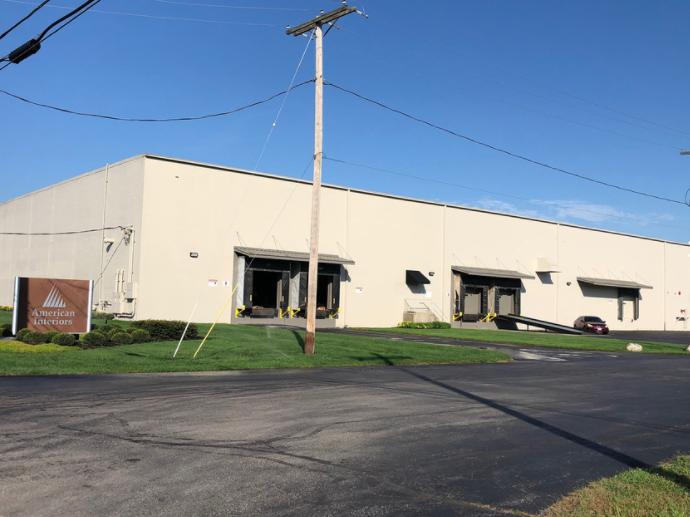
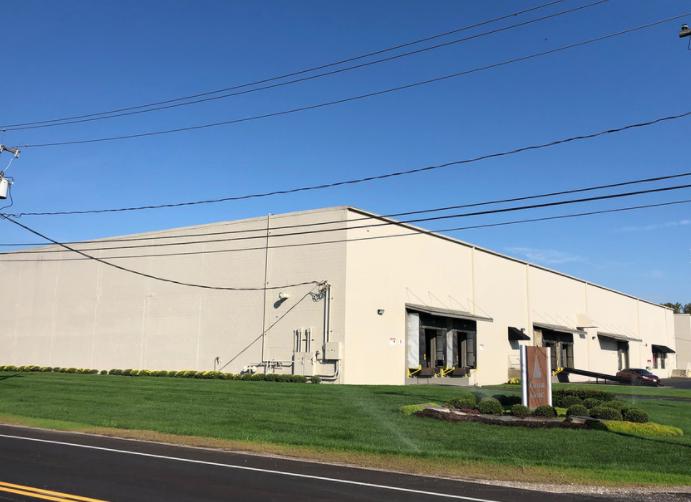
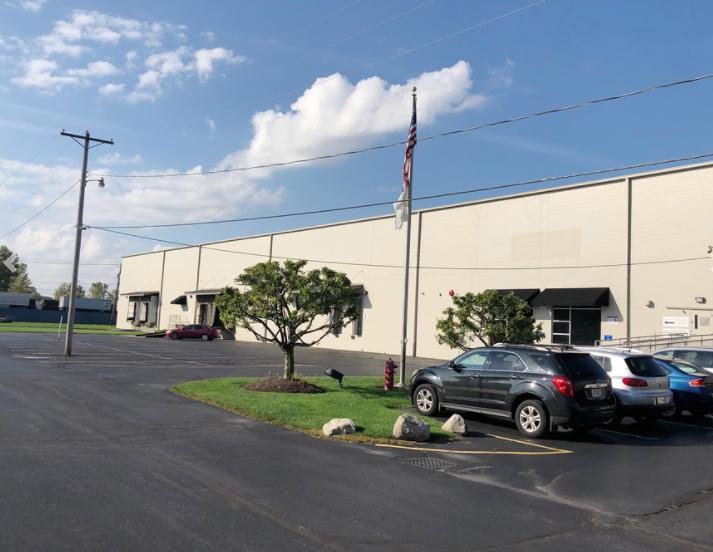
302 South Byrne Road Toledo, OH 43615
302 South Byrne Road Toledo, OH 43615
Details & Description
Listing Agents

Ron Jurgenson
O: 419-794-3959
rjurgenson@rkgcommercial.com
O: 419-794-3959
rjurgenson@rkgcommercial.com
While we strive to provide the most accurate information, all listing information, and demographic data, is provided by third-parties. As such, MyEListing will not be responsible for the accuracy of the information. It is strongly recommended that you verify all information with the listing agent, and any relevant agencies, prior to making any decisions.