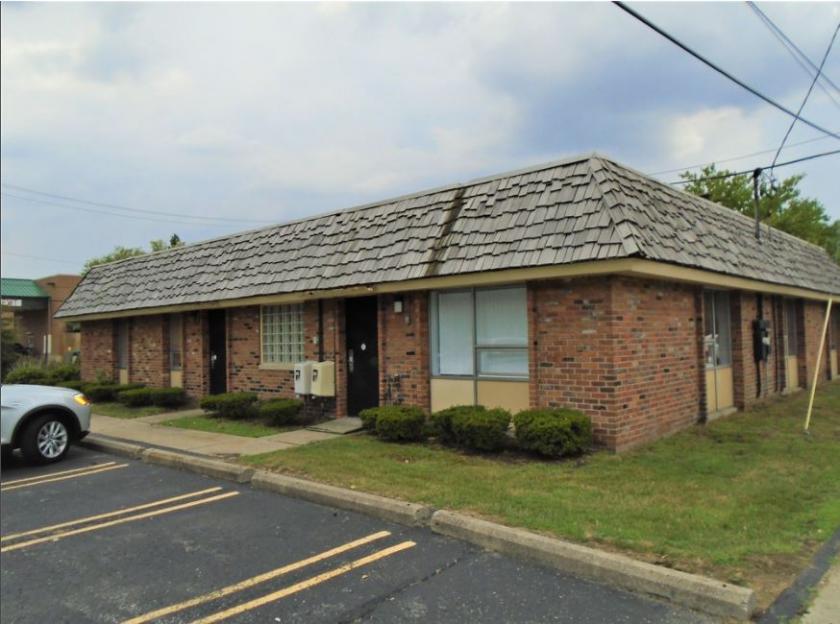
Stunning 3,000 SF single-story brick office building in "plug & play" condition
Central location to Telegraph Road, I-696, and Grand River
Hands-on pro-active owner that has kept all functions in just new or recently replaced condition
Upgraded electric panel/category 5 wire throughout
2018 roof, new water heater, 1 year old air conditioning, recent furnace units, and security systems
Upgraded lighting and newer drop-ceiling tiles/lights
Excellent company headquarters or professional offices for law, CPA, or financial planning
Furnishings could be purchased
Sale Price: $495,000
No part of this information may be copied, reproduced, repurposed, or screen-captured for any commercial purpose without prior written authorization from MyEListing.
While we strive to provide the most accurate information, all listing information, and demographic data, is provided by third-parties. As such, MyEListing will not be responsible for the accuracy of the information. It is strongly recommended that you verify all information with the listing agent, and any relevant agencies, prior to making any decisions.
What is the asking price for 22142 West Nine Mile Road in Southfield?
The asking price for 22142 West Nine Mile Road is $495,000
What is the building size of this Office property in Southfield, MI?
The size of the building/unit at 22142 West Nine Mile Road in Southfield is 3,000 square feet
What kind of Office is the propery at 22142 West Nine Mile Road?
The property at 22142 West Nine Mile Road Southfield, MI 48033 is listed as a Professional Office property
What is the population within 1 mile of 22142 West Nine Mile Road in Southfield?
The population within 1 mile of 22142 West Nine Mile Road Southfield, MI 48033 is 6,408 people.
Who do I contact for questions about 22142 West Nine Mile Road?
You should contact the listing agent,
Dan Verderbar, for any details regarding this commercial listing.