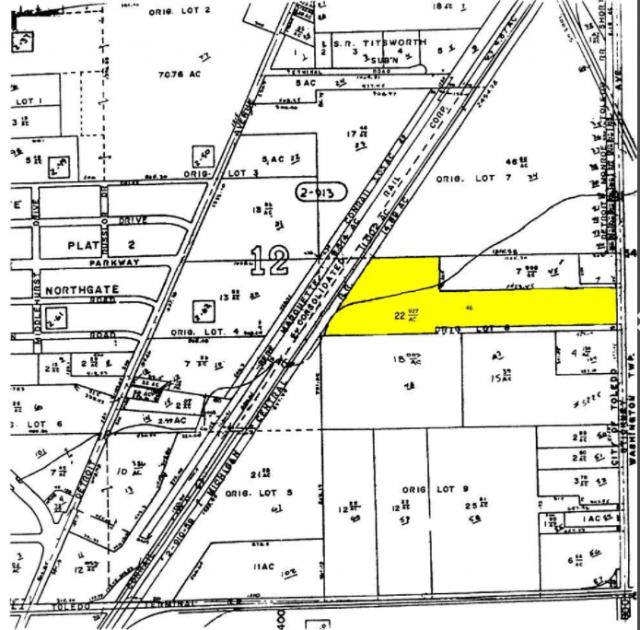
1-Mile | 3-Miles | 5-Miles | ||
---|---|---|---|---|
Total Population | 1,568 | 60,550 | 166,947 | |
Population Median Age | 40 | 37 | 38 | |
Population by Age | 0-9 Yrs | 179 (11%) | 8674 (14%) | 22327 (13%) |
10-19 Yrs | 130 (8%) | 8416 (13%) | 22292 (13%) | |
20-29 Yrs | 305 (19%) | 8219 (13%) | 23489 (14%) | |
30-39 Yrs | 165 (10%) | 8562 (14%) | 21774 (13%) | |
40-49 Yrs | 118 (7%) | 7129 (11%) | 20280 (12%) | |
50-59 Yrs | 339 (21%) | 8197 (13%) | 22538 (13%) | |
60-69 Yrs | 205 (13%) | 6340 (10%) | 19436 (11%) | |
70+ Yrs | 127 (8%) | 5014 (8%) | 14812 (8%) | |
Median HH Income | $43,105 | $40,393 | $40,088 | |
Total Household Income | < 24K | 177 (22%) | 7163 (29%) | 22495 (31%) |
25-49K | 326 (41%) | 7275 (29%) | 19292 (27%) | |
50-74K | 164 (20%) | 4200 (17%) | 11768 (16%) | |
75-99K | 31 (3%) | 2902 (11%) | 7957 (11%) | |
100-199K | 94 (11%) | 2797 (11%) | 8091 (11%) | |
200K+ | 0 (0%) | 261 (1%) | 1000 (1%) | |
Highest Education Level | No Diploma | 167 | 5266 | 15279 |
Diploma or GED | 370 | 15095 | 39153 | |
Some College | 442 | 10584 | 29647 | |
Assoc. Degree | 120 | 4063 | 11010 | |
Bachelors Degree | 57 | 3603 | 12152 | |
Higher Degree | 22 | 1307 | 5113 | |
Total Housing Units | 913 | 28,748 | 83,949 | |
--Owner-Occupied | 378 | 14,304 | 39,567 | |
--Renter-Occupied | 412 | 10,295 | 31,036 | |
Owner-Occupied Values | < 100K | 341 | 10507 | 25131 |
100-199K | 37 | 2995 | 11349 | |
200-299K | 0 | 553 | 2119 | |
300-399K | 0 | 142 | 487 | |
400-499K | 0 | 54 | 207 | |
500K+ | 0 | 53 | 273 | |
Total Working Age Population | 1,322 | 46,342 | 130,942 | |
In Work Force | 943 | 28,775 | 80,116 | |
Not In Work Force | 379 | 17,566 | 50,826 | |
Workforce Employed | 869 | 26,072 | 73,208 | |
Workforce Unemployed | 62 | 2,653 | 6,812 | |
Civlian Workforce | 931 | 28,725 | 80,021 | |
Military Workforce | 12 | 51 | 95 | |
Total Households | 791 | 24,598 | 70,602 | |
Family Households | 362 | 14,737 | 40,451 | |
Non-Family Households | 429 | 9,861 | 30,151 | |
Married Couple | 218 | 7,714 | 22,622 | |
Other Family | 144 | 7,023 | 17,829 | |
Married w/Child | 84 | 2,689 | 7,776 | |
Single Male w/Child | 11 | 867 | 2,261 | |
Single Female w/Child | 56 | 3,423 | 8,548 |
Population Change Last Two Decades - Plus Projection
2000 | % | 2010 | % | 2020 | % | 2030 | |
---|---|---|---|---|---|---|---|
Michigan | 9,938,444 | -1 | 9,883,640 | +1 | 10,023,423 | +4 | 10,424,510 |
Monroe County | 145,945 | +4 | 152,021 | -2 | 149,610 | +2 | 153,038 |
Ohio | 11,353,140 | +2 | 11,536,504 | 0 | 11,574,870 | 0 | 11,615,100 |
Lucas County | 455,054 | -3 | 441,815 | -3 | 430,450 | -2 | 420,080 |
Total Working Age Population:
Total Households:
Total Working Age Population:
Total Households:
Total Working Age Population:
Total Households: