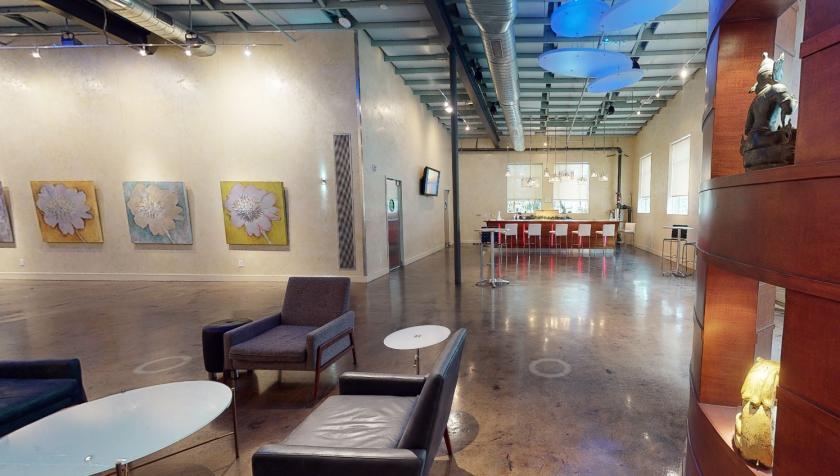
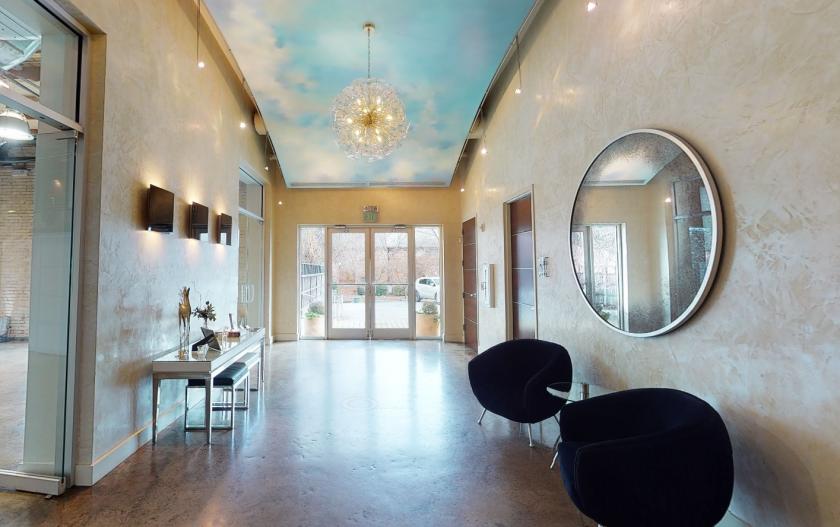
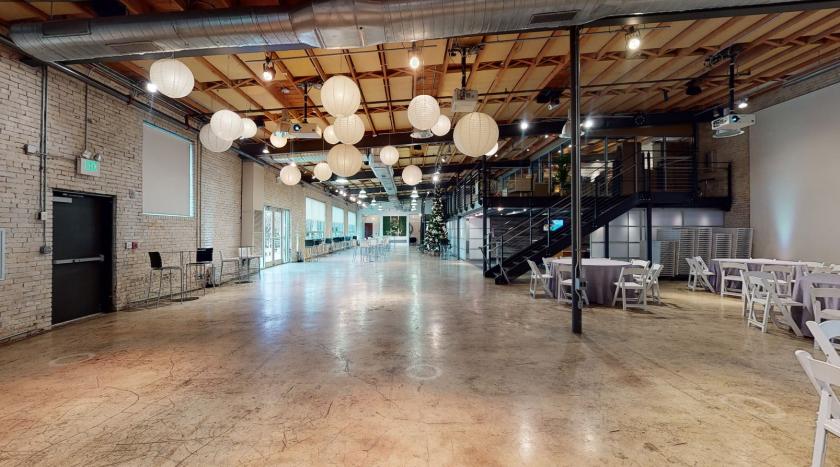
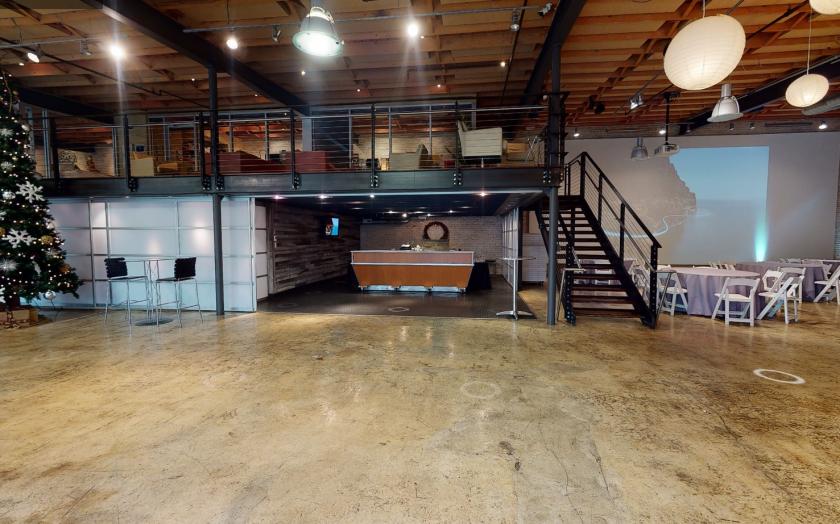
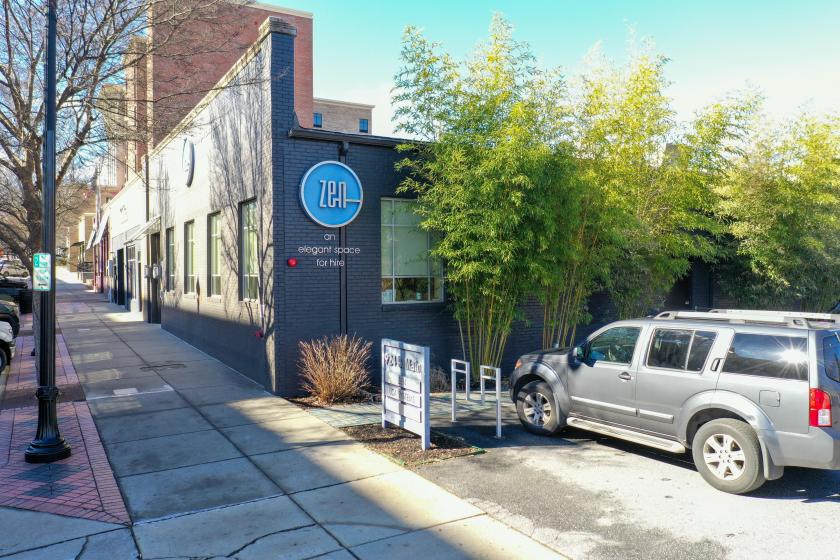
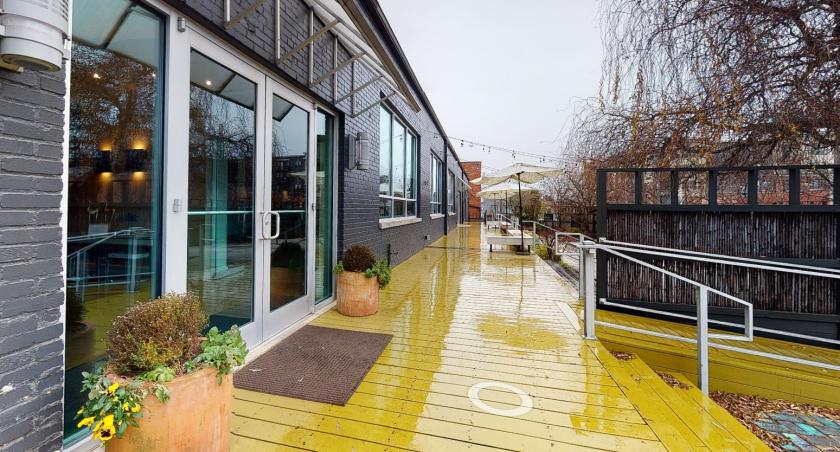
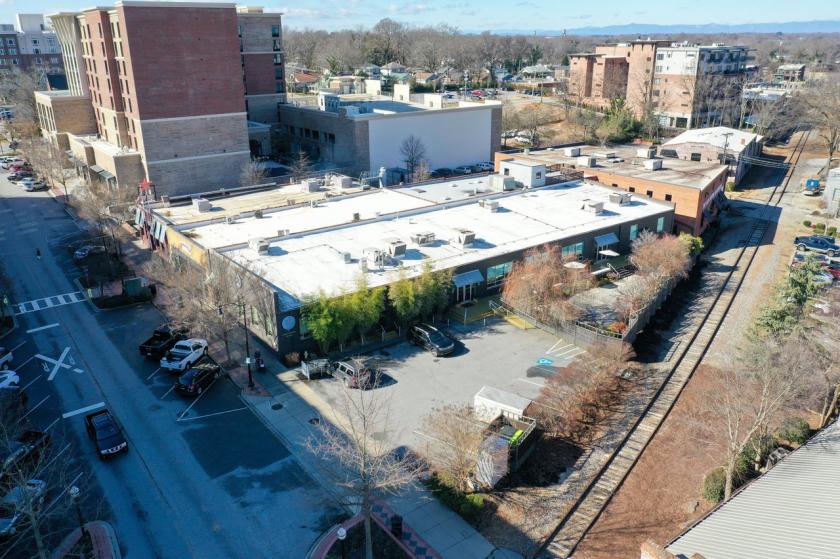
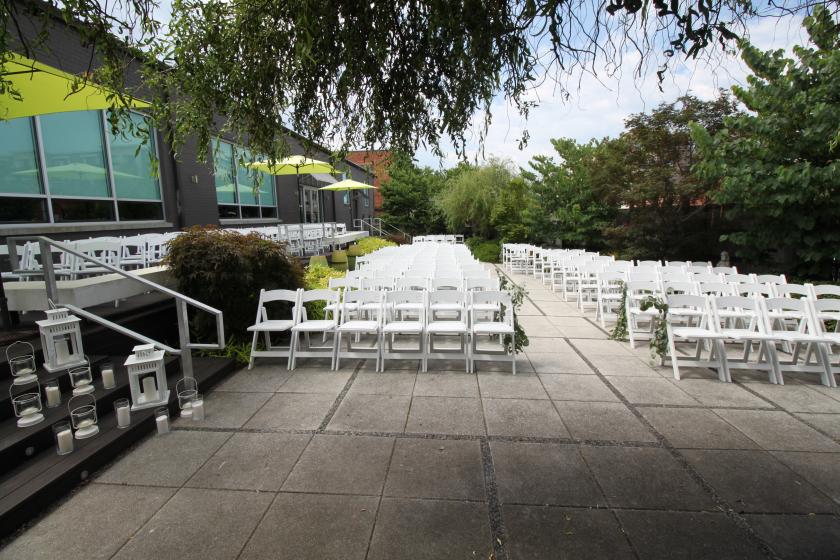
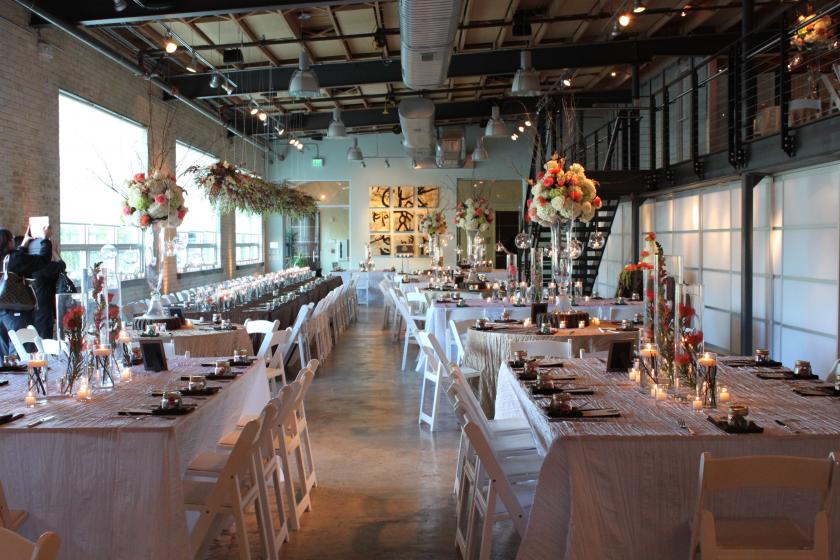
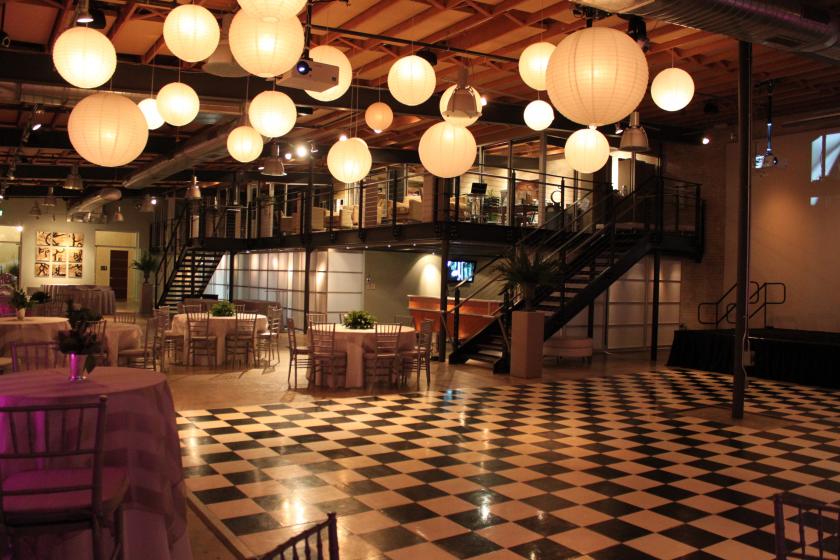
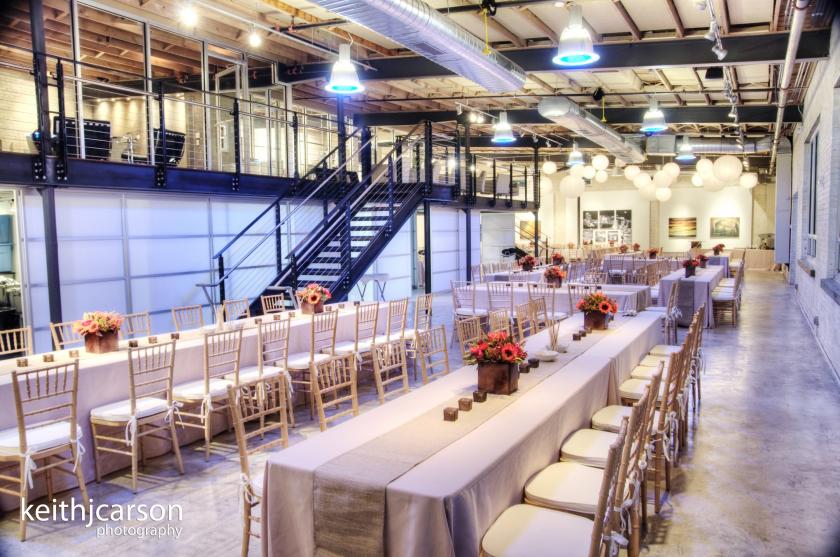
Retail Space
924 South Main Street Greenville, SC 29601
924 South Main Street Greenville, SC 29601
Details & Description
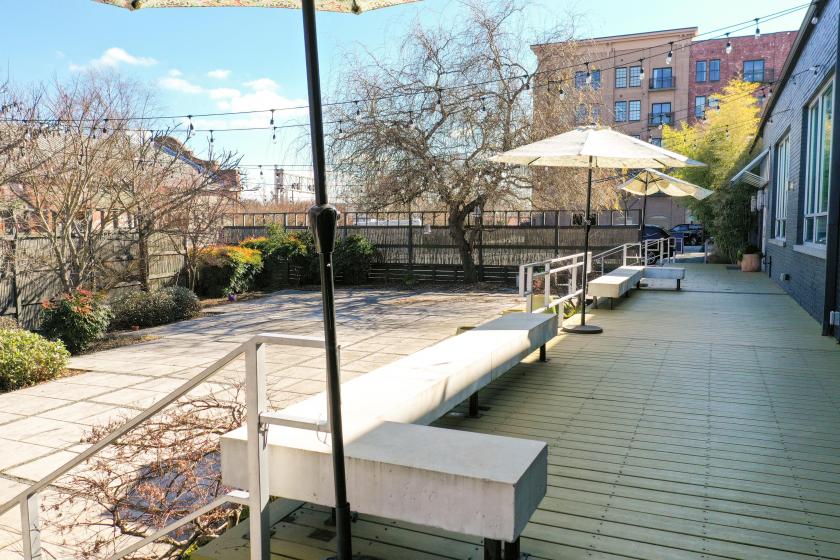
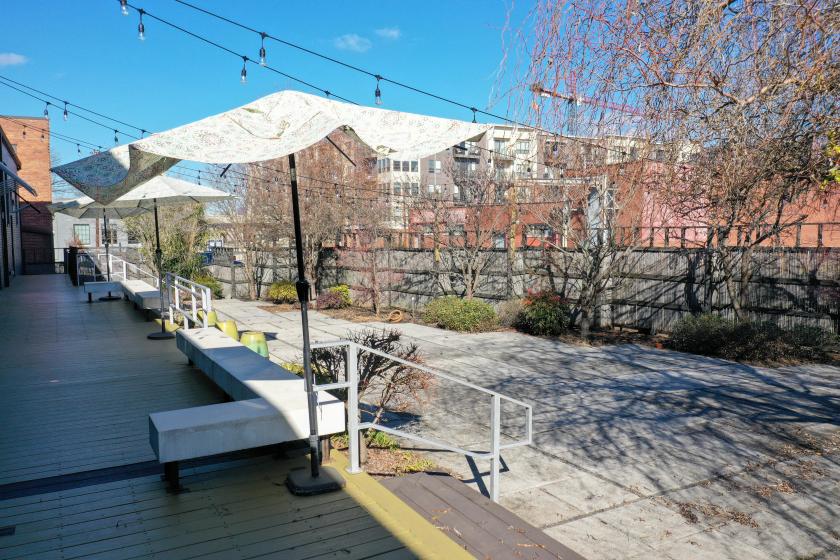
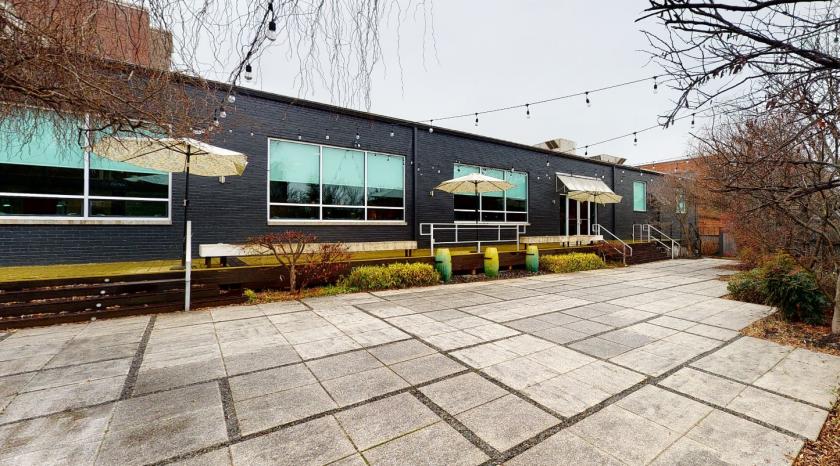
Additional Photos
Listing Agents

Marketing Coordinator
O: 864-233-7724
lcarter@joynercommercial.com
O: 864-233-7724
lcarter@joynercommercial.com

Matt Carter
O: 864-335-2020
M: 864-313-9078
MCarter@joynercommercial.com
O: 864-335-2020
M: 864-313-9078
MCarter@joynercommercial.com
While we strive to provide the most accurate information, all listing information, and demographic data, is provided by third-parties. As such, MyEListing will not be responsible for the accuracy of the information. It is strongly recommended that you verify all information with the listing agent, and any relevant agencies, prior to making any decisions.