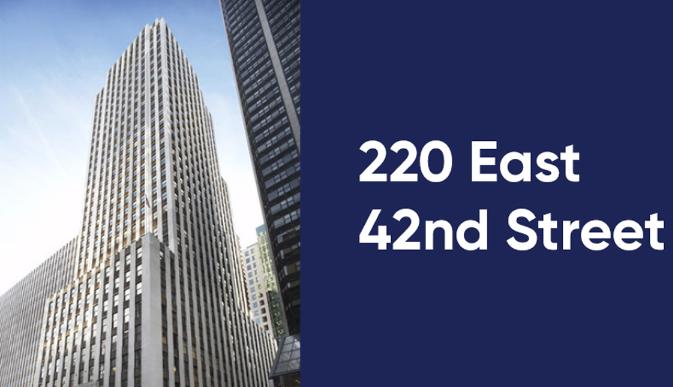
Office Space
220 East 42nd Street, 29th Floor New York, NY 10017
220 East 42nd Street, 29th Floor New York, NY 10017
Details & Description
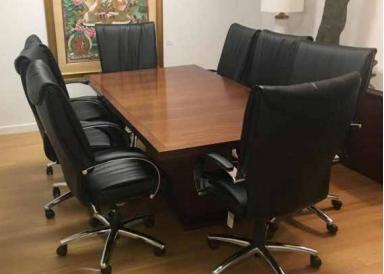
Additional Photos


Listing Agents

Gregg Cohen
O: 212-687-4329
M: 917-684-1764
gcohen@cresa.com
O: 212-687-4329
M: 917-684-1764
gcohen@cresa.com
While we strive to provide the most accurate information, all listing information, and demographic data, is provided by third-parties. As such, MyEListing will not be responsible for the accuracy of the information. It is strongly recommended that you verify all information with the listing agent, and any relevant agencies, prior to making any decisions.


