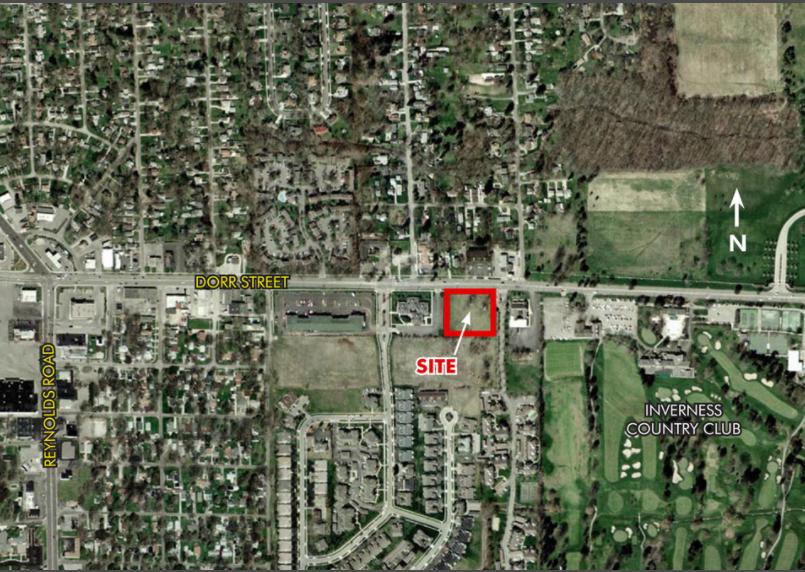
1-Mile | 3-Miles | 5-Miles | ||
---|---|---|---|---|
Total Population | 8,289 | 76,374 | 225,498 | |
Population Median Age | 40 | 38 | 39 | |
Population by Age | 0-9 Yrs | 1126 (13%) | 9432 (12%) | 27999 (12%) |
10-19 Yrs | 481 (5%) | 9338 (12%) | 27134 (12%) | |
20-29 Yrs | 1605 (19%) | 14691 (19%) | 36477 (16%) | |
30-39 Yrs | 1183 (14%) | 9053 (11%) | 27910 (12%) | |
40-49 Yrs | 583 (7%) | 6665 (8%) | 24804 (10%) | |
50-59 Yrs | 1111 (13%) | 9145 (11%) | 29094 (12%) | |
60-69 Yrs | 1240 (14%) | 8997 (11%) | 27959 (12%) | |
70+ Yrs | 962 (11%) | 9053 (11%) | 24121 (10%) | |
Median HH Income | $46,907 | $43,992 | $48,244 | |
Total Household Income | < 24K | 886 (25%) | 9635 (29%) | 26039 (26%) |
25-49K | 909 (26%) | 8128 (25%) | 23717 (24%) | |
50-74K | 653 (19%) | 5463 (16%) | 16891 (17%) | |
75-99K | 341 (9%) | 3105 (9%) | 10970 (11%) | |
100-199K | 574 (16%) | 4916 (15%) | 15923 (16%) | |
200K+ | 63 (1%) | 1087 (3%) | 3361 (3%) | |
Highest Education Level | No Diploma | 782 | 5072 | 15148 |
Diploma or GED | 1777 | 12782 | 41249 | |
Some College | 1335 | 11509 | 36220 | |
Assoc. Degree | 545 | 4975 | 15020 | |
Bachelors Degree | 976 | 8384 | 27387 | |
Higher Degree | 463 | 6606 | 17911 | |
Total Housing Units | 3,742 | 35,861 | 108,243 | |
--Owner-Occupied | 1,846 | 16,987 | 55,399 | |
--Renter-Occupied | 1,580 | 15,347 | 41,502 | |
Owner-Occupied Values | < 100K | 1012 | 7670 | 23920 |
100-199K | 593 | 6227 | 21697 | |
200-299K | 65 | 1671 | 6256 | |
300-399K | 31 | 525 | 1642 | |
400-499K | 10 | 223 | 635 | |
500K+ | 134 | 670 | 1249 | |
Total Working Age Population | 6,886 | 62,400 | 182,091 | |
In Work Force | 3,950 | 38,837 | 116,690 | |
Not In Work Force | 2,935 | 23,563 | 65,401 | |
Workforce Employed | 3,777 | 35,969 | 108,854 | |
Workforce Unemployed | 172 | 2,815 | 7,721 | |
Civlian Workforce | 3,949 | 38,783 | 116,575 | |
Military Workforce | 2 | 54 | 116 | |
Total Households | 3,427 | 32,333 | 96,901 | |
Family Households | 1,982 | 17,621 | 54,994 | |
Non-Family Households | 1,445 | 14,712 | 41,907 | |
Married Couple | 1,468 | 11,329 | 35,912 | |
Other Family | 514 | 6,292 | 19,082 | |
Married w/Child | 492 | 3,640 | 12,427 | |
Single Male w/Child | 76 | 840 | 2,756 | |
Single Female w/Child | 91 | 2,771 | 8,232 |
Population Change Last Two Decades - Plus Projection
2000 | % | 2010 | % | 2020 | % | 2030 | |
---|---|---|---|---|---|---|---|
Michigan | 9,938,444 | -1 | 9,883,640 | +1 | 10,023,423 | +4 | 10,424,510 |
Monroe County | 145,945 | +4 | 152,021 | -2 | 149,610 | +2 | 153,038 |
Ohio | 11,353,140 | +2 | 11,536,504 | 0 | 11,574,870 | 0 | 11,615,100 |
Lucas County | 455,054 | -3 | 441,815 | -3 | 430,450 | -2 | 420,080 |
Wood County | 121,065 | +4 | 125,488 | +4 | 130,870 | +3 | 134,280 |
Total Working Age Population:
Total Households:
Total Working Age Population:
Total Households:
Total Working Age Population:
Total Households: