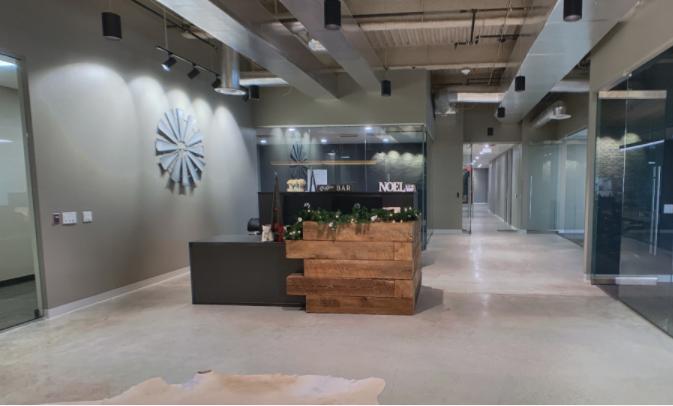
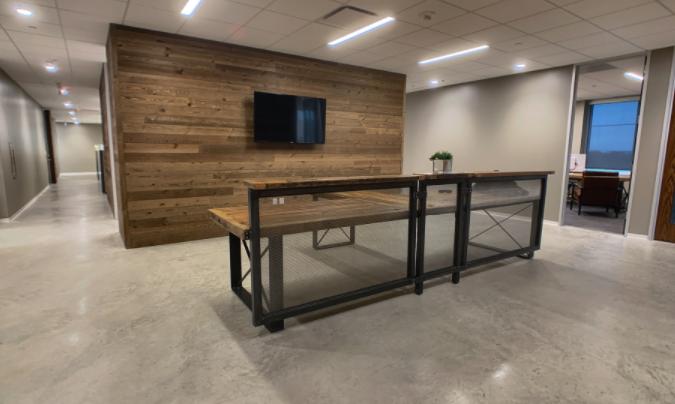
1-Mile | 3-Miles | 5-Miles | ||
---|---|---|---|---|
Total Population | 9,026 | 79,509 | 189,397 | |
Population Median Age | 33 | 33 | 34 | |
Population by Age | 0-9 Yrs | 1485 (16%) | 13135 (16%) | 30266 (15%) |
10-19 Yrs | 1626 (18%) | 13279 (16%) | 32004 (16%) | |
20-29 Yrs | 743 (8%) | 8467 (10%) | 18261 (9%) | |
30-39 Yrs | 1302 (14%) | 12458 (15%) | 28700 (15%) | |
40-49 Yrs | 1957 (21%) | 13954 (17%) | 32329 (17%) | |
50-59 Yrs | 949 (10%) | 8803 (11%) | 21896 (11%) | |
60-69 Yrs | 551 (6%) | 5478 (6%) | 14995 (7%) | |
70+ Yrs | 413 (4%) | 3935 (4%) | 10948 (5%) | |
Median HH Income | $138,146 | $109,674 | $110,902 | |
Total Household Income | < 24K | 164 (5%) | 1673 (6%) | 4374 (7%) |
25-49K | 293 (10%) | 3068 (12%) | 7083 (11%) | |
50-74K | 261 (9%) | 3665 (14%) | 8171 (13%) | |
75-99K | 242 (8%) | 3018 (12%) | 7280 (12%) | |
100-199K | 1068 (38%) | 8970 (35%) | 21852 (36%) | |
200K+ | 766 (27%) | 4668 (18%) | 11428 (18%) | |
Highest Education Level | No Diploma | 292 | 3124 | 6897 |
Diploma or GED | 610 | 7454 | 17369 | |
Some College | 974 | 10605 | 24390 | |
Assoc. Degree | 454 | 4085 | 9733 | |
Bachelors Degree | 1813 | 13744 | 35660 | |
Higher Degree | 1398 | 10107 | 24438 | |
Total Housing Units | 2,925 | 26,458 | 63,334 | |
--Owner-Occupied | 2,124 | 17,721 | 44,481 | |
--Renter-Occupied | 669 | 7,341 | 15,707 | |
Owner-Occupied Values | < 100K | 25 | 719 | 1543 |
100-199K | 159 | 3588 | 9540 | |
200-299K | 458 | 5567 | 13720 | |
300-399K | 727 | 3913 | 9896 | |
400-499K | 427 | 2258 | 5047 | |
500K+ | 327 | 1677 | 4735 | |
Total Working Age Population | 6,398 | 57,417 | 137,766 | |
In Work Force | 4,448 | 40,288 | 94,451 | |
Not In Work Force | 1,950 | 17,129 | 43,315 | |
Workforce Employed | 4,185 | 38,063 | 88,965 | |
Workforce Unemployed | 263 | 2,178 | 5,394 | |
Civlian Workforce | 4,448 | 40,241 | 94,359 | |
Military Workforce | 0 | 47 | 92 | |
Total Households | 2,794 | 25,062 | 60,188 | |
Family Households | 2,401 | 20,625 | 49,441 | |
Non-Family Households | 393 | 4,438 | 10,747 | |
Married Couple | 2,078 | 17,442 | 41,501 | |
Other Family | 322 | 3,183 | 7,940 | |
Married w/Child | 1,398 | 10,636 | 24,463 | |
Single Male w/Child | 72 | 544 | 1,190 | |
Single Female w/Child | 115 | 1,174 | 3,360 |
Population Change Last Two Decades - Plus Projection
2000 | % | 2010 | % | 2020 | % | 2030 | |
---|---|---|---|---|---|---|---|
Texas | 20,851,820 | +21 | 25,145,561 | +18 | 29,677,668 | +18 | 34,894,452 |
Fort Bend County | 354,452 | +65 | 585,375 | +44 | 840,383 | +43 | 1,203,029 |
Harris County | 3,400,578 | +20 | 4,092,459 | +22 | 4,978,845 | +19 | 5,924,750 |
Waller County | 32,663 | +32 | 43,205 | +17 | 50,731 | +16 | 59,021 |
Total Working Age Population:
Total Households:
Total Working Age Population:
Total Households:
Total Working Age Population:
Total Households: