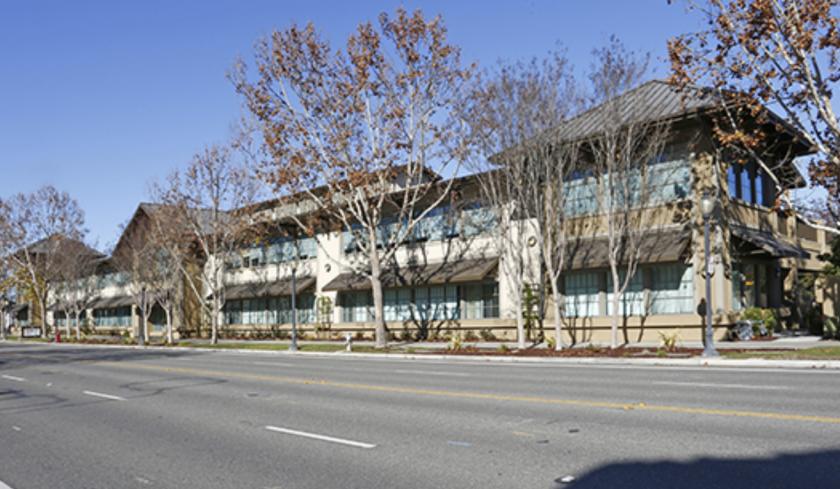
1-Mile | 3-Miles | 5-Miles | ||
---|---|---|---|---|
Total Population | 27,017 | 167,356 | 347,664 | |
Population Median Age | 36 | 37 | 38 | |
Population by Age | 0-9 Yrs | 3243 (12%) | 21253 (12%) | 43678 (12%) |
10-19 Yrs | 2027 (7%) | 16891 (10%) | 37218 (10%) | |
20-29 Yrs | 5076 (18%) | 25932 (15%) | 49762 (14%) | |
30-39 Yrs | 6053 (22%) | 31019 (18%) | 61320 (17%) | |
40-49 Yrs | 3630 (13%) | 23606 (14%) | 50265 (14%) | |
50-59 Yrs | 2958 (10%) | 19198 (11%) | 41870 (12%) | |
60-69 Yrs | 2197 (8%) | 14465 (8%) | 30433 (8%) | |
70+ Yrs | 1833 (6%) | 14991 (8%) | 33118 (9%) | |
Median HH Income | $144,406 | $151,237 | $149,586 | |
Total Household Income | < 24K | 897 (7%) | 5675 (8%) | 10945 (8%) |
25-49K | 1129 (9%) | 5487 (8%) | 11216 (8%) | |
50-74K | 978 (8%) | 5421 (8%) | 11341 (8%) | |
75-99K | 948 (8%) | 4829 (7%) | 10721 (8%) | |
100-199K | 3837 (32%) | 20002 (30%) | 39402 (30%) | |
200K+ | 3996 (33%) | 23794 (36%) | 47579 (36%) | |
Highest Education Level | No Diploma | 985 | 7421 | 14728 |
Diploma or GED | 1768 | 9682 | 20273 | |
Some College | 1950 | 11845 | 24725 | |
Assoc. Degree | 987 | 6019 | 12482 | |
Bachelors Degree | 6543 | 36349 | 76079 | |
Higher Degree | 8071 | 49408 | 101422 | |
Total Housing Units | 12,670 | 69,210 | 139,092 | |
--Owner-Occupied | 4,620 | 30,761 | 65,469 | |
--Renter-Occupied | 7,166 | 34,445 | 65,735 | |
Owner-Occupied Values | < 100K | 77 | 377 | 1571 |
100-199K | 124 | 459 | 1903 | |
200-299K | 104 | 361 | 1356 | |
300-399K | 147 | 451 | 928 | |
400-499K | 80 | 263 | 612 | |
500K+ | 4087 | 28849 | 59098 | |
Total Working Age Population | 22,408 | 134,556 | 279,122 | |
In Work Force | 16,872 | 95,359 | 192,398 | |
Not In Work Force | 5,537 | 39,197 | 86,724 | |
Workforce Employed | 16,234 | 92,057 | 185,402 | |
Workforce Unemployed | 586 | 3,135 | 6,769 | |
Civlian Workforce | 16,820 | 95,192 | 192,172 | |
Military Workforce | 52 | 167 | 226 | |
Total Households | 11,785 | 65,206 | 131,204 | |
Family Households | 6,223 | 41,021 | 87,622 | |
Non-Family Households | 5,562 | 24,186 | 43,582 | |
Married Couple | 4,972 | 34,141 | 73,679 | |
Other Family | 1,251 | 6,880 | 13,944 | |
Married w/Child | 2,219 | 16,187 | 36,240 | |
Single Male w/Child | 108 | 809 | 1,844 | |
Single Female w/Child | 456 | 2,129 | 4,114 |
Population Change Last Two Decades - Plus Projection
2000 | % | 2010 | % | 2020 | % | 2030 | |
---|---|---|---|---|---|---|---|
California | 33,871,648 | +10 | 37,253,956 | +9 | 40,467,295 | +8 | 43,631,295 |
Alameda County | 1,443,741 | +5 | 1,510,271 | +12 | 1,696,752 | +10 | 1,861,027 |
San Mateo County | 707,161 | +2 | 718,451 | +9 | 785,650 | +6 | 833,868 |
Santa Clara County | 1,682,585 | +6 | 1,781,642 | +12 | 1,996,394 | +10 | 2,194,079 |
Total Working Age Population:
Total Households:
Total Working Age Population:
Total Households:
Total Working Age Population:
Total Households: