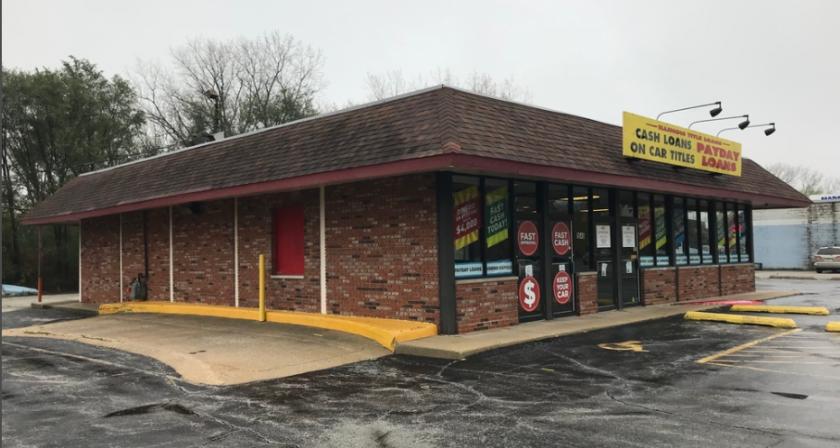
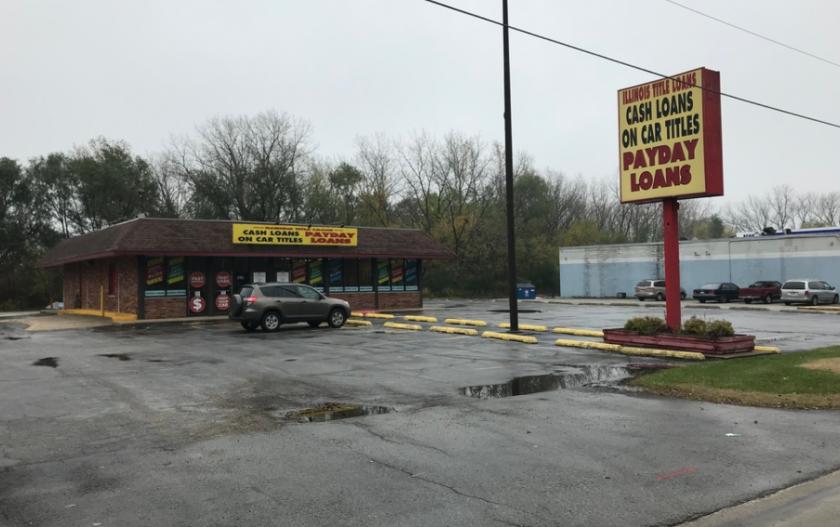
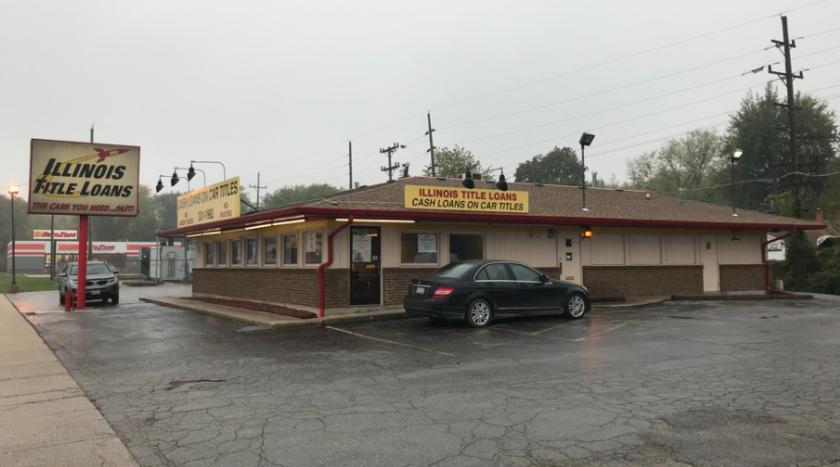
1-Mile | 3-Miles | 5-Miles | ||
---|---|---|---|---|
Total Population | 11,760 | 82,534 | 165,915 | |
Population Median Age | 38 | 39 | 39 | |
Population by Age | 0-9 Yrs | 1465 (12%) | 10021 (12%) | 19824 (11%) |
10-19 Yrs | 1843 (15%) | 11551 (13%) | 23769 (14%) | |
20-29 Yrs | 1532 (13%) | 11011 (13%) | 21487 (12%) | |
30-39 Yrs | 1232 (10%) | 9336 (11%) | 18881 (11%) | |
40-49 Yrs | 1661 (14%) | 11224 (13%) | 21878 (13%) | |
50-59 Yrs | 1411 (11%) | 11100 (13%) | 23219 (13%) | |
60-69 Yrs | 1454 (12%) | 9666 (11%) | 19908 (11%) | |
70+ Yrs | 1161 (9%) | 8624 (10%) | 16949 (10%) | |
Median HH Income | $48,056 | $56,148 | $62,166 | |
Total Household Income | < 24K | 1186 (27%) | 7103 (23%) | 12715 (20%) |
25-49K | 1016 (23%) | 6634 (21%) | 12262 (19%) | |
50-74K | 671 (15%) | 5528 (17%) | 10449 (17%) | |
75-99K | 602 (14%) | 4126 (13%) | 8925 (14%) | |
100-199K | 655 (15%) | 6237 (20%) | 14537 (23%) | |
200K+ | 128 (3%) | 1245 (4%) | 2458 (4%) | |
Highest Education Level | No Diploma | 956 | 6008 | 9190 |
Diploma or GED | 2070 | 14826 | 28141 | |
Some College | 2151 | 15167 | 30838 | |
Assoc. Degree | 813 | 4794 | 9744 | |
Bachelors Degree | 1080 | 8218 | 19882 | |
Higher Degree | 707 | 5970 | 13413 | |
Total Housing Units | 4,875 | 35,089 | 68,295 | |
--Owner-Occupied | 2,536 | 19,857 | 42,738 | |
--Renter-Occupied | 1,721 | 11,017 | 18,606 | |
Owner-Occupied Values | < 100K | 1473 | 8344 | 13553 |
100-199K | 826 | 7886 | 19824 | |
200-299K | 156 | 2149 | 6430 | |
300-399K | 40 | 759 | 1750 | |
400-499K | 8 | 345 | 540 | |
500K+ | 34 | 375 | 643 | |
Total Working Age Population | 9,260 | 65,506 | 131,448 | |
In Work Force | 5,719 | 40,942 | 83,499 | |
Not In Work Force | 3,541 | 24,564 | 47,949 | |
Workforce Employed | 5,241 | 36,778 | 74,871 | |
Workforce Unemployed | 463 | 4,102 | 8,554 | |
Civlian Workforce | 5,704 | 40,880 | 83,425 | |
Military Workforce | 16 | 62 | 75 | |
Total Households | 4,257 | 30,873 | 61,345 | |
Family Households | 2,673 | 19,228 | 39,737 | |
Non-Family Households | 1,584 | 11,646 | 21,608 | |
Married Couple | 1,300 | 11,231 | 24,145 | |
Other Family | 1,373 | 7,997 | 15,591 | |
Married w/Child | 468 | 4,047 | 8,644 | |
Single Male w/Child | 189 | 1,013 | 1,692 | |
Single Female w/Child | 420 | 2,641 | 5,559 |
Population Change Last Two Decades - Plus Projection
2000 | % | 2010 | % | 2020 | % | 2030 | |
---|---|---|---|---|---|---|---|
Illinois | 12,419,293 | +3 | 12,830,632 | +12 | 14,316,487 | +6 | 15,138,849 |
Cook County | 5,376,741 | -3 | 5,194,675 | +10 | 5,707,832 | +5 | 5,990,243 |
Will County | 502,266 | +35 | 677,560 | +34 | 907,625 | +20 | 1,093,207 |
Total Working Age Population:
Total Households:
Total Working Age Population:
Total Households:
Total Working Age Population:
Total Households: