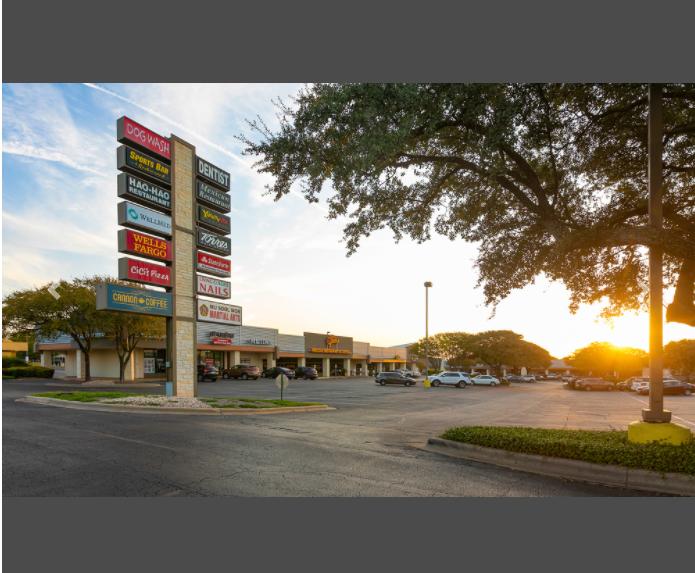
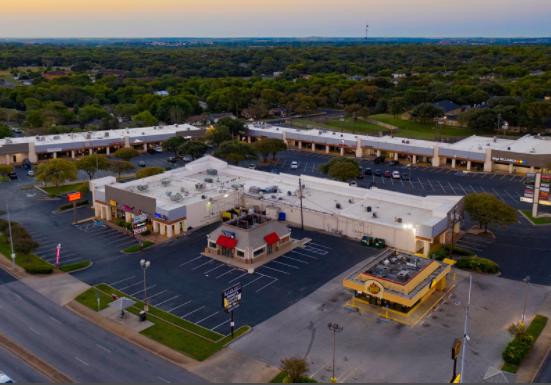
CSA Realty Group (“CSA”) is pleased to present the fee-simple sale of Towne Square Center, a ±77,574 SF community-minded shopping center in the heart of South Austin.
Uniquely positioned to service South Austin, community-minded, and internet resistant tenants, Town Square Center is a stable investment with long-term viability. The property is ideally located on the corner of William Canon and Manchaca providing easy access to area residents.
The 96.5% leased center’s commanding presence is a result of its excellent location and visibility as well as its strong tenants.
Highlights
Credit Tenants in 96.51% occupied center
Wells Fargo, Casa Garcia, Betsy's Billiards, Vida Dental and WellMed Medical serve as co-anchors
Church's Fried Chicken and Shipley's Donuts are their own parcel
Densely populated area with strong retail submarket
Highly functional site plan
Historically high occupancy
2 million dollar renovation in 2018
No part of this information may be copied, reproduced, repurposed, or screen-captured for any commercial purpose without prior written authorization from MyEListing.
While we strive to provide the most accurate information, all listing information, and demographic data, is provided by third-parties. As such, MyEListing will not be responsible for the accuracy of the information. It is strongly recommended that you verify all information with the listing agent, and any relevant agencies, prior to making any decisions.
What is the building size of this Retail property in Austin, TX?
The size of the building/unit at 1901 West William Cannon Drive in Austin is 77,574 square feet
How much land does the Austin, TX property at 1901 West William Cannon Drive include?
1901 West William Cannon Drive in Austin includes 7.903 acres of land
What kind of Retail is the propery at 1901 West William Cannon Drive?
The property at 1901 West William Cannon Drive Austin, TX 78745 is listed as a Shopping Center Retail property
What is the population within 1 mile of 1901 West William Cannon Drive in Austin?
The population within 1 mile of 1901 West William Cannon Drive Austin, TX 78745 is 15,640 people.
Who do I contact for questions about 1901 West William Cannon Drive?
You should contact the listing agent,
Grady Field, for any details regarding this commercial listing.