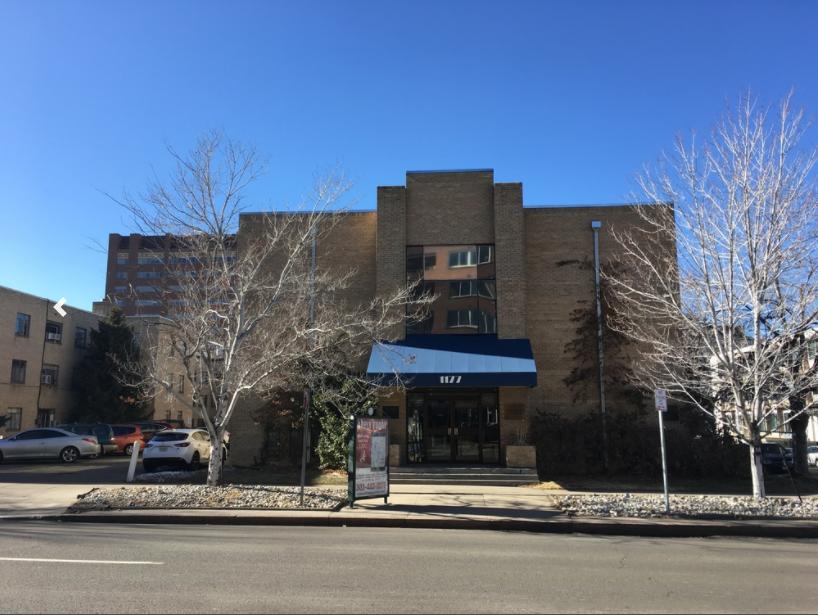
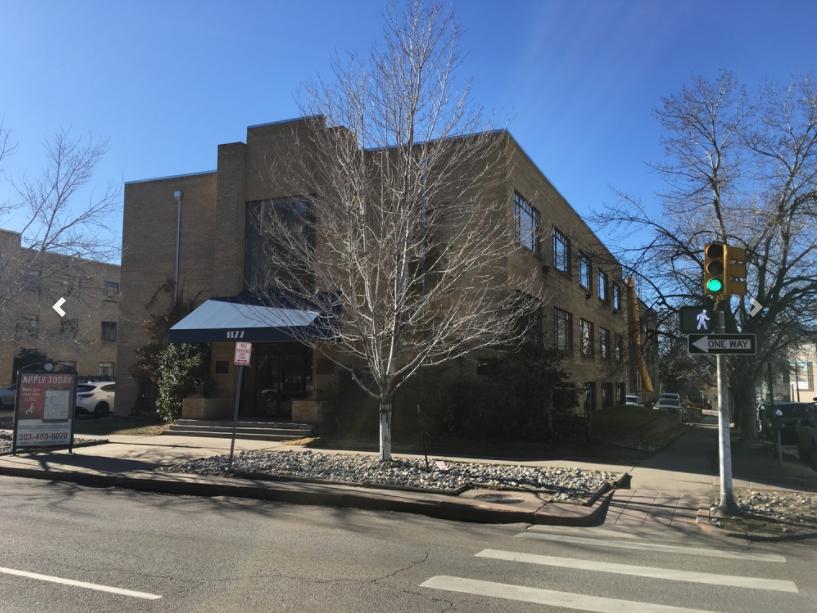
The Newton Building is conveniently located at the corner of 12th and Grant on the edge of Denver’s Central Business District. This building is in a prime location just 2 blocks away from the State Capitol Building and many Denver attractions. 1177 Grant St provides some of the most affordable office lease rates for professional tenants seeking quality space near Denver’s Downtown and CBD. There is excellent access to major commuter routes such as Interstate 25, Speer Boulevard, Broadway, and Colfax Avenue as well as the 16th Street Mall, RTD public transportation, and Union Station.
Highlights
Walking Distance to Municipal Buildings, Capitol Building, Civic Center
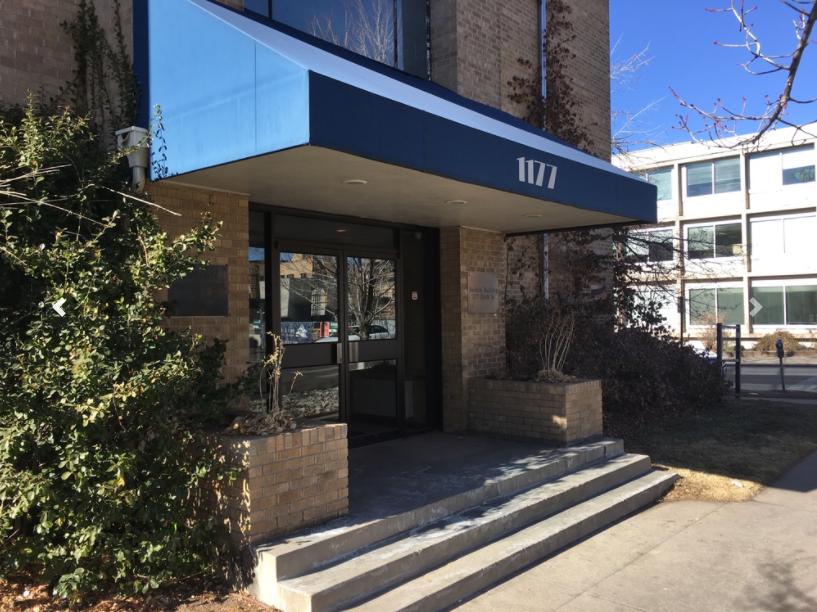
Secured Building with On-Site Ownership and Property Management
Great Central Business District Alternative
On-Site Reserved Parking Available
Common Area Conference Room and Break Room/Kitchen
No part of this information may be copied, reproduced, repurposed, or screen-captured for any commercial purpose without prior written authorization from MyEListing.
While we strive to provide the most accurate information, all listing information, and demographic data, is provided by third-parties. As such, MyEListing will not be responsible for the accuracy of the information. It is strongly recommended that you verify all information with the listing agent, and any relevant agencies, prior to making any decisions.
What is the asking price for 1177 Grant Street in Denver?
The asking price for 1177 Grant Street is $18.00 a SF per Year
What is the building size of this commercial Office property?
The size of this multi-unit property varies between 574 - 2081 square feet
What kind of Office is the propery at 1177 Grant Street?
The property at 1177 Grant Street Denver, CO 80203 is listed as a Professional Office property
What is the population within 1 mile of 1177 Grant Street in Denver?
The population within 1 mile of 1177 Grant Street Denver, CO 80203 is 46,149 people.
Who do I contact for questions about 1177 Grant Street?
You should contact the listing agent,
Brian McKernan, for any details regarding this commercial listing.