Specialty Real Estate
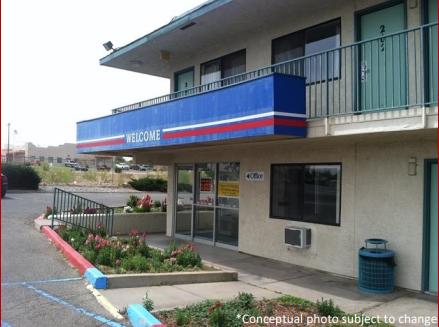
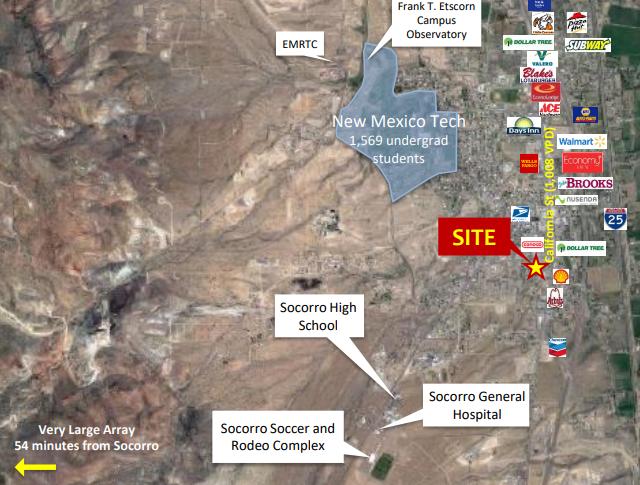
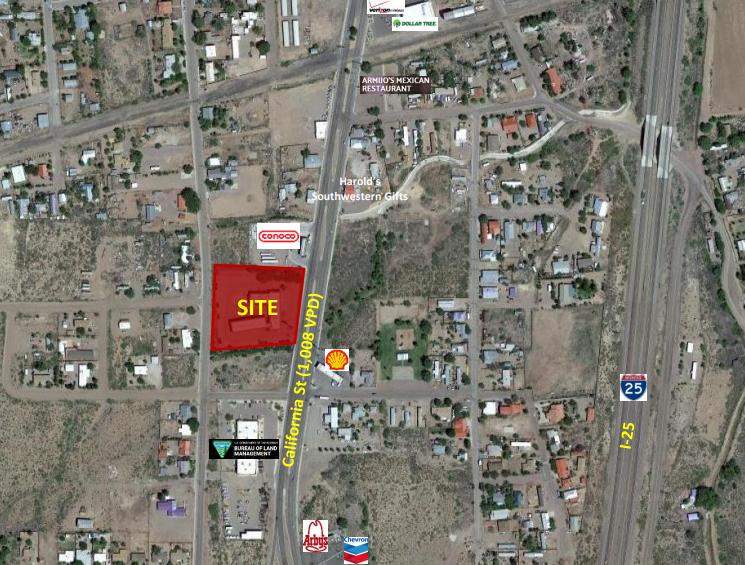
807 Old US Hwy 85 Socorro, NM 87801
807 Old US Hwy 85 Socorro, NM 87801
Details & Description
Listing Agents

Consuelo Horne
O: 505-730-7395
consuelo@go-absolute.net
O: 505-730-7395
consuelo@go-absolute.net
While we strive to provide the most accurate information, all listing information, and demographic data, is provided by third-parties. As such, MyEListing will not be responsible for the accuracy of the information. It is strongly recommended that you verify all information with the listing agent, and any relevant agencies, prior to making any decisions.