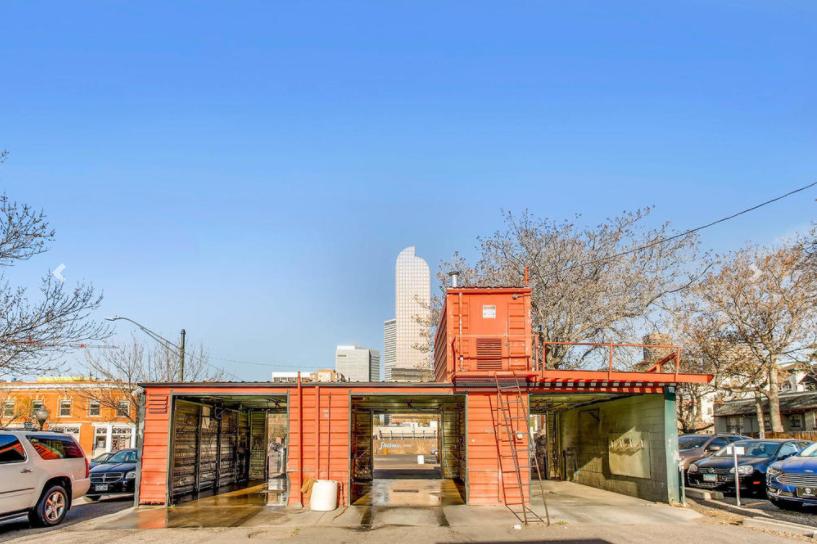
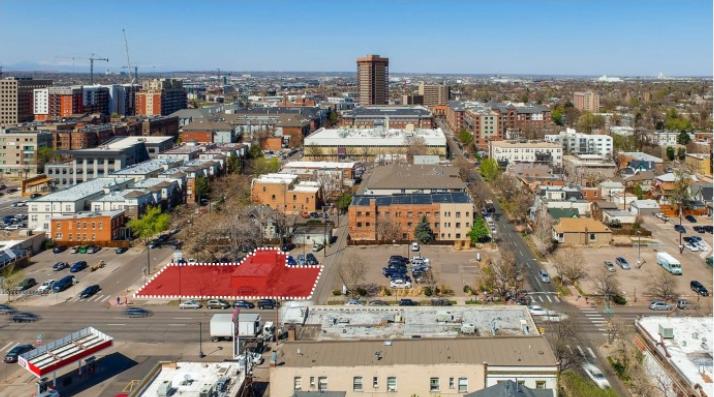
Unique Properties, as exclusive agent to the Seller, is pleased to present for acquisition to qualified parties, 601 17th Avenue located in the Uptown Neighborhood in Denver, Colorado. The Uptown neighborhood, is one of the most sought after neighborhoods in Denver. The property provides easy access to downtown and the other surrounding areas. This parcel has “Main
Street” zoning which allows for a multitude of different uses for the property. This is a one of a kind asset and is the type of property that usually only comes available once in a lifetime.
Highlights
8 story zoning with zero setbacks on the ground floor.
Sought after Uptown neighborhood.
Close proximity Presbyterian St. Luke's and St. Joe's
Plethora of Dining, Shopping, and Entertainment options nearby.
No part of this information may be copied, reproduced, repurposed, or screen-captured for any commercial purpose without prior written authorization from MyEListing.
While we strive to provide the most accurate information, all listing information, and demographic data, is provided by third-parties. As such, MyEListing will not be responsible for the accuracy of the information. It is strongly recommended that you verify all information with the listing agent, and any relevant agencies, prior to making any decisions.
What is the asking price for 601 East 17th Avenue in Denver?
The asking price for 601 East 17th Avenue is $4,250,000
How much land does the Denver, CO property at 601 East 17th Avenue include?
601 East 17th Avenue in Denver includes 0.144 acres of land
What kind of Land is the propery at 601 East 17th Avenue?
The property at 601 East 17th Avenue Denver, CO 80203 is listed as a Mixed Use Land Land property
What is the population within 1 mile of 601 East 17th Avenue in Denver?
The population within 1 mile of 601 East 17th Avenue Denver, CO 80203 is 46,863 people.
Who do I contact for questions about 601 East 17th Avenue?
You should contact the listing agent,
Marc Lippitt, for any details regarding this commercial listing.