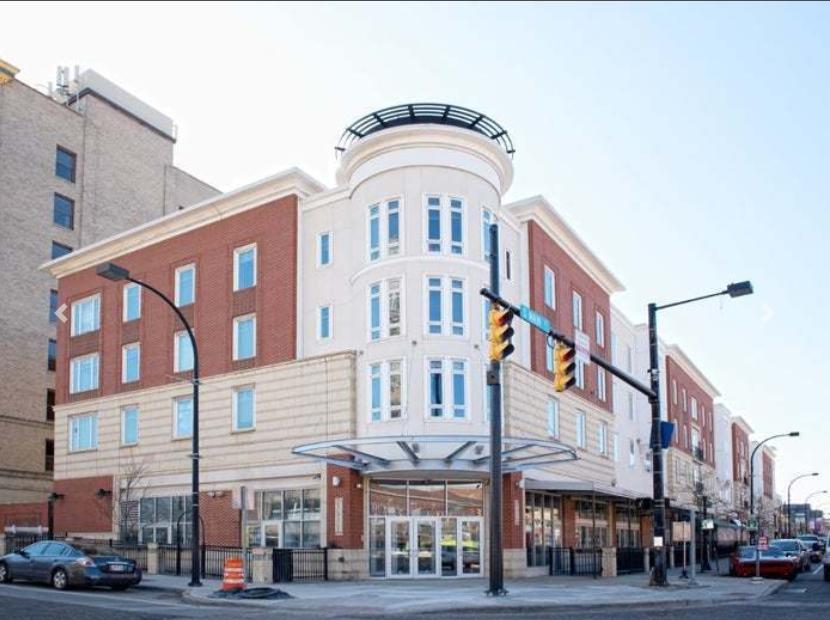
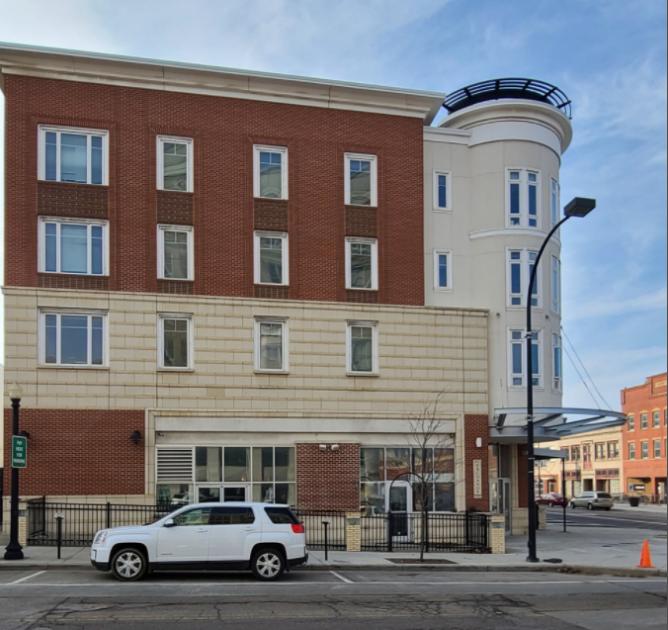
New Ownership! Ground level retail available. Part of “The Standard” mixed-use property consisting of 236 market rate apartments and ground retail. The Standard is located in the walkable historic Main-Exchange District, surrounded by over 625 units within two blocks, and thousands of downtown employees and downtown destination attractions.
Highlights
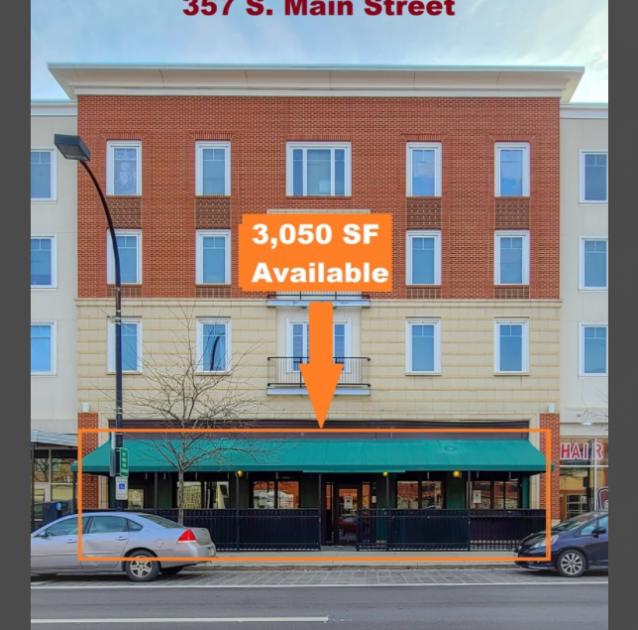
1,000 - 6,000 sf available
Some units with covered patios
22,000 VPD on E. Exchange Street & 15,000 VPD on S. Main Street
Over 625 new apartments units within two blocks
Join existing retailers: Jimmy Johns, Insomnia Cookies, Walgreens, Muggswigz, Subway, Diamond Deli, DaVinci's Pizza (2 strong additional tenants coming soon!)
Over 2,300 residential units/apartments in downtown + hundreds more planned 2021
Over 60,000+ daytime population within 1 mile
Within 1.5 miles of 6 of Akron’s largest employers
Close proximity to downtown amenities such as, Lock 3, Canal Park Stadium, Akron Civic Theater, Canal Place, Towpath Trail, and many retail, restaurant & entertainment venues
One block from Canal Park- home of the Akron RubberDucks, AA affiliate of the Cleveland Indians
Major city infrastructure investments along Main St (new roads, curbs, sewer/utilities, streetscapes, lighting)
Growing residential population in/around downtown Akron
Surrounded by premier major medical systems: Akron Children's Hospital, Summa Health, and Cleveland Clinic Akron General
Walking distance from The University of Akron (25,000 students); Stark State College Akron campus (5,000 students) nearby
Aggressive lease rates, attractive TI packages, and collaborative new ownership