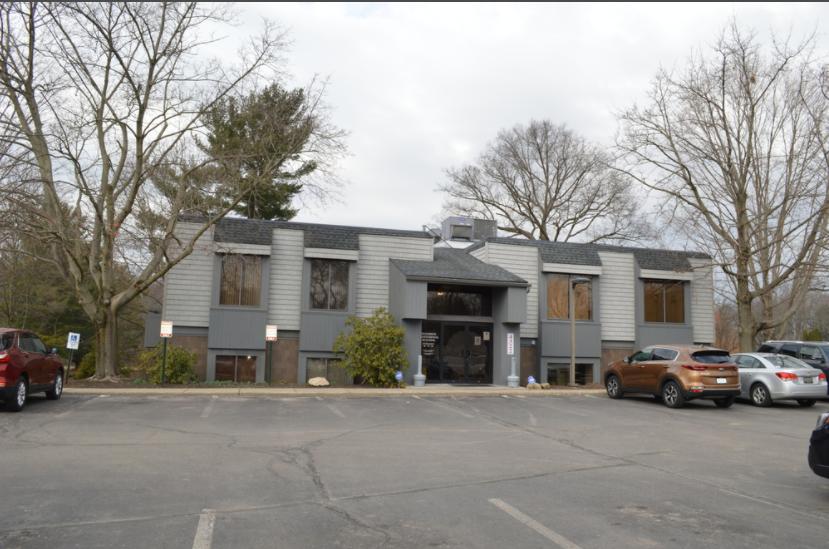
1-Mile | 3-Miles | 5-Miles | ||
---|---|---|---|---|
Total Population | 5,853 | 34,705 | 87,991 | |
Population Median Age | 40 | 41 | 41 | |
Population by Age | 0-9 Yrs | 629 (10%) | 4181 (12%) | 10192 (11%) |
10-19 Yrs | 724 (12%) | 4035 (11%) | 9938 (11%) | |
20-29 Yrs | 720 (12%) | 4343 (12%) | 11615 (13%) | |
30-39 Yrs | 710 (12%) | 4169 (12%) | 10259 (11%) | |
40-49 Yrs | 906 (15%) | 3939 (11%) | 10695 (12%) | |
50-59 Yrs | 930 (15%) | 5107 (14%) | 13165 (14%) | |
60-69 Yrs | 596 (10%) | 4638 (13%) | 11820 (13%) | |
70+ Yrs | 637 (10%) | 4293 (12%) | 10306 (11%) | |
Median HH Income | $51,189 | $48,093 | $51,268 | |
Total Household Income | < 24K | 409 (17%) | 3420 (24%) | 7965 (21%) |
25-49K | 738 (31%) | 3932 (27%) | 9890 (27%) | |
50-74K | 516 (21%) | 2677 (18%) | 6963 (19%) | |
75-99K | 249 (10%) | 1924 (13%) | 5029 (13%) | |
100-199K | 401 (17%) | 1953 (13%) | 5661 (15%) | |
200K+ | 38 (1%) | 283 (1%) | 974 (2%) | |
Highest Education Level | No Diploma | 544 | 3048 | 6460 |
Diploma or GED | 1831 | 10815 | 25399 | |
Some College | 627 | 4145 | 11615 | |
Assoc. Degree | 310 | 2205 | 6189 | |
Bachelors Degree | 512 | 3119 | 8738 | |
Higher Degree | 328 | 1419 | 4502 | |
Total Housing Units | 2,581 | 15,550 | 39,965 | |
--Owner-Occupied | 1,637 | 9,412 | 24,459 | |
--Renter-Occupied | 713 | 4,775 | 12,023 | |
Owner-Occupied Values | < 100K | 796 | 4465 | 10813 |
100-199K | 630 | 3853 | 9388 | |
200-299K | 162 | 835 | 2988 | |
300-399K | 29 | 170 | 762 | |
400-499K | 8 | 35 | 223 | |
500K+ | 13 | 53 | 285 | |
Total Working Age Population | 4,792 | 27,991 | 71,663 | |
In Work Force | 3,035 | 17,128 | 44,636 | |
Not In Work Force | 1,756 | 10,863 | 27,028 | |
Workforce Employed | 2,817 | 15,884 | 42,219 | |
Workforce Unemployed | 184 | 1,173 | 2,325 | |
Civlian Workforce | 3,000 | 17,057 | 44,545 | |
Military Workforce | 35 | 72 | 91 | |
Total Households | 2,350 | 14,188 | 36,481 | |
Family Households | 1,469 | 8,941 | 22,613 | |
Non-Family Households | 881 | 5,247 | 13,868 | |
Married Couple | 1,136 | 6,431 | 15,990 | |
Other Family | 333 | 2,510 | 6,623 | |
Married w/Child | 433 | 2,159 | 5,418 | |
Single Male w/Child | 44 | 257 | 833 | |
Single Female w/Child | 110 | 1,051 | 2,163 |
Population Change Last Two Decades - Plus Projection
2000 | % | 2010 | % | 2020 | % | 2030 | |
---|---|---|---|---|---|---|---|
Ohio | 11,353,140 | +2 | 11,536,504 | 0 | 11,574,870 | 0 | 11,615,100 |
Medina County | 151,095 | +14 | 172,332 | +7 | 184,670 | +5 | 194,510 |
Stark County | 378,098 | -1 | 375,586 | -2 | 368,210 | -2 | 361,130 |
Summit County | 542,899 | 0 | 541,781 | -1 | 534,150 | -1 | 528,990 |
Wayne County | 111,564 | +3 | 114,520 | 0 | 114,390 | -1 | 113,400 |
Total Working Age Population:
Total Households:
Total Working Age Population:
Total Households:
Total Working Age Population:
Total Households: