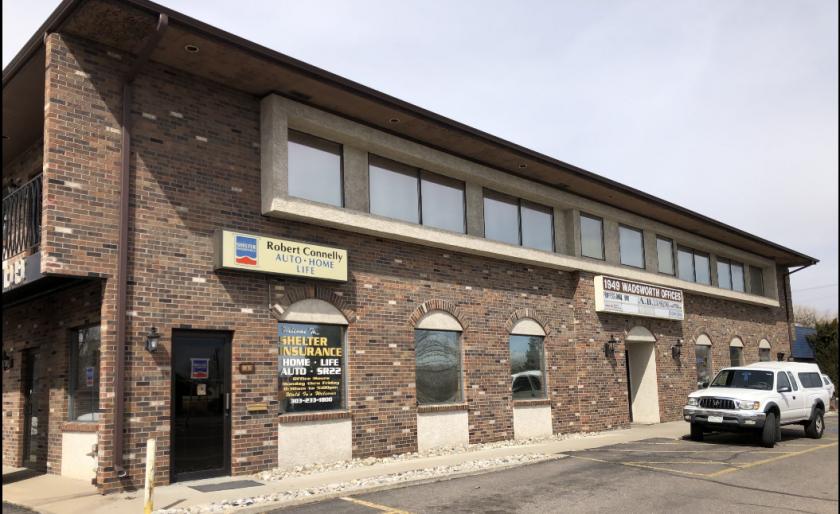
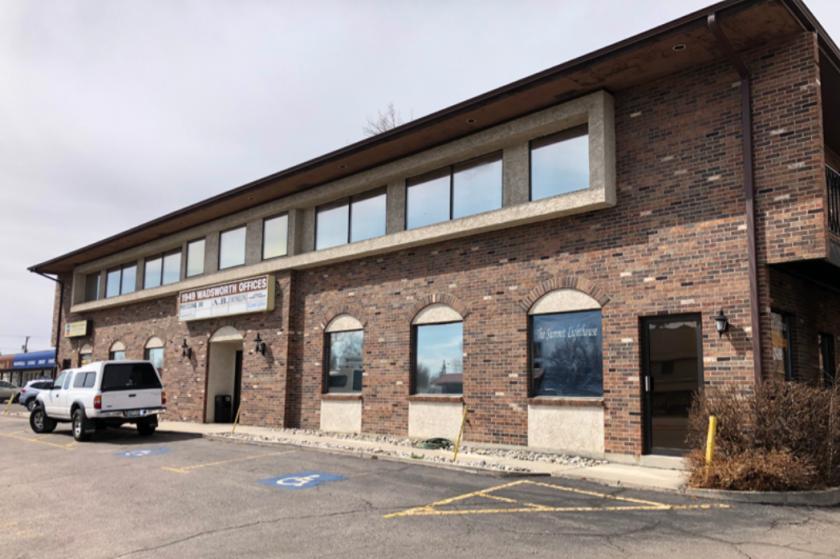
1-Mile | 3-Miles | 5-Miles | ||
---|---|---|---|---|
Total Population | 16,122 | 138,593 | 388,202 | |
Population Median Age | 40 | 39 | 38 | |
Population by Age | 0-9 Yrs | 1334 (8%) | 14718 (10%) | 43037 (11%) |
10-19 Yrs | 1435 (8%) | 13683 (9%) | 40673 (10%) | |
20-29 Yrs | 2967 (18%) | 22841 (16%) | 67688 (17%) | |
30-39 Yrs | 2709 (16%) | 24811 (17%) | 69272 (17%) | |
40-49 Yrs | 2328 (14%) | 18251 (13%) | 49427 (12%) | |
50-59 Yrs | 2014 (12%) | 15350 (11%) | 44007 (11%) | |
60-69 Yrs | 1766 (10%) | 14727 (10%) | 38483 (9%) | |
70+ Yrs | 1569 (9%) | 14212 (10%) | 35616 (9%) | |
Median HH Income | $50,452 | $60,265 | $64,678 | |
Total Household Income | < 24K | 1847 (25%) | 12162 (20%) | 31366 (19%) |
25-49K | 1717 (23%) | 12604 (21%) | 32310 (19%) | |
50-74K | 1552 (21%) | 10931 (18%) | 29666 (18%) | |
75-99K | 642 (8%) | 7045 (11%) | 21202 (12%) | |
100-199K | 1144 (15%) | 12713 (21%) | 37709 (23%) | |
200K+ | 287 (3%) | 4259 (7%) | 11350 (6%) | |
Highest Education Level | No Diploma | 1728 | 13016 | 36424 |
Diploma or GED | 3149 | 22356 | 63760 | |
Some College | 3092 | 20372 | 52507 | |
Assoc. Degree | 666 | 5600 | 16556 | |
Bachelors Degree | 2538 | 25784 | 70870 | |
Higher Degree | 964 | 13908 | 38034 | |
Total Housing Units | 7,536 | 62,777 | 173,308 | |
--Owner-Occupied | 2,879 | 29,974 | 84,262 | |
--Renter-Occupied | 4,309 | 29,741 | 79,340 | |
Owner-Occupied Values | < 100K | 108 | 668 | 2392 |
100-199K | 319 | 2167 | 7650 | |
200-299K | 556 | 5522 | 17415 | |
300-399K | 575 | 6942 | 21664 | |
400-499K | 859 | 6250 | 15826 | |
500K+ | 462 | 8425 | 19314 | |
Total Working Age Population | 13,865 | 115,088 | 320,576 | |
In Work Force | 9,255 | 79,744 | 224,275 | |
Not In Work Force | 4,610 | 35,344 | 96,301 | |
Workforce Employed | 8,756 | 76,302 | 215,475 | |
Workforce Unemployed | 493 | 3,375 | 8,655 | |
Civlian Workforce | 9,249 | 79,676 | 224,130 | |
Military Workforce | 6 | 68 | 145 | |
Total Households | 7,188 | 59,714 | 163,602 | |
Family Households | 3,204 | 30,609 | 85,009 | |
Non-Family Households | 3,984 | 29,105 | 78,593 | |
Married Couple | 2,083 | 21,431 | 59,296 | |
Other Family | 1,121 | 9,178 | 25,713 | |
Married w/Child | 725 | 8,199 | 22,764 | |
Single Male w/Child | 185 | 1,136 | 3,483 | |
Single Female w/Child | 307 | 3,233 | 8,798 |
Population Change Last Two Decades - Plus Projection
2000 | % | 2010 | % | 2020 | % | 2030 | |
---|---|---|---|---|---|---|---|
Colorado | 4,301,261 | +17 | 5,029,196 | +16 | 5,838,181 | +15 | 6,733,658 |
Adams County | 363,857 | +21 | 441,603 | +20 | 530,680 | +21 | 642,318 |
Arapahoe County | 487,967 | +17 | 572,003 | +16 | 662,304 | +13 | 750,773 |
Denver County | 554,636 | +8 | 600,158 | +23 | 738,611 | +12 | 827,681 |
Jefferson County | 527,056 | +1 | 534,543 | +10 | 587,118 | +7 | 626,742 |
Total Working Age Population:
Total Households:
Total Working Age Population:
Total Households:
Total Working Age Population:
Total Households: