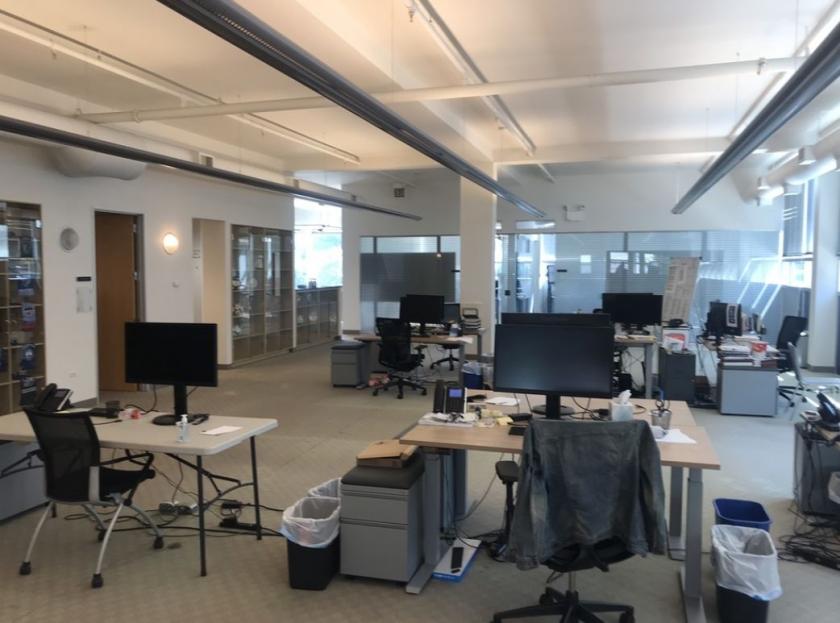
1-Mile | 3-Miles | 5-Miles | ||
---|---|---|---|---|
Total Population | 47,899 | 344,544 | 795,922 | |
Population Median Age | 39 | 38 | 36 | |
Population by Age | 0-9 Yrs | 3383 (7%) | 26113 (7%) | 77294 (9%) |
10-19 Yrs | 3228 (6%) | 26278 (7%) | 72461 (9%) | |
20-29 Yrs | 9598 (20%) | 78973 (22%) | 184523 (23%) | |
30-39 Yrs | 11355 (23%) | 74175 (21%) | 160592 (20%) | |
40-49 Yrs | 6212 (12%) | 39629 (11%) | 91081 (11%) | |
50-59 Yrs | 6474 (13%) | 38053 (11%) | 80473 (10%) | |
60-69 Yrs | 4064 (8%) | 35644 (10%) | 72945 (9%) | |
70+ Yrs | 3585 (7%) | 25679 (7%) | 56553 (7%) | |
Median HH Income | $98,987 | $90,055 | $74,608 | |
Total Household Income | < 24K | 5018 (19%) | 34733 (19%) | 80649 (22%) |
25-49K | 2173 (8%) | 20180 (11%) | 54363 (14%) | |
50-74K | 2813 (10%) | 21309 (12%) | 47775 (13%) | |
75-99K | 3016 (11%) | 19005 (10%) | 39394 (10%) | |
100-199K | 7992 (30%) | 47662 (27%) | 87813 (24%) | |
200K+ | 4783 (18%) | 32447 (18%) | 54126 (14%) | |
Highest Education Level | No Diploma | 2864 | 21884 | 67735 |
Diploma or GED | 3124 | 28481 | 86092 | |
Some College | 3935 | 29787 | 69867 | |
Assoc. Degree | 1538 | 8942 | 22586 | |
Bachelors Degree | 11620 | 87408 | 174571 | |
Higher Degree | 15310 | 87059 | 155152 | |
Total Housing Units | 28,403 | 201,152 | 416,952 | |
--Owner-Occupied | 12,025 | 67,533 | 135,025 | |
--Renter-Occupied | 13,769 | 107,802 | 229,095 | |
Owner-Occupied Values | < 100K | 223 | 1823 | 6742 |
100-199K | 467 | 4537 | 18931 | |
200-299K | 2331 | 12593 | 24971 | |
300-399K | 3589 | 14210 | 22309 | |
400-499K | 2181 | 10479 | 17462 | |
500K+ | 3234 | 23891 | 44609 | |
Total Working Age Population | 42,878 | 306,272 | 680,031 | |
In Work Force | 31,976 | 218,611 | 469,995 | |
Not In Work Force | 10,901 | 87,662 | 210,036 | |
Workforce Employed | 30,973 | 207,589 | 440,548 | |
Workforce Unemployed | 857 | 10,777 | 28,986 | |
Civlian Workforce | 31,830 | 218,366 | 469,534 | |
Military Workforce | 146 | 244 | 461 | |
Total Households | 25,794 | 175,335 | 364,120 | |
Family Households | 10,511 | 69,434 | 155,470 | |
Non-Family Households | 15,283 | 105,902 | 208,650 | |
Married Couple | 8,292 | 51,745 | 103,665 | |
Other Family | 2,220 | 17,688 | 51,805 | |
Married w/Child | 2,201 | 14,449 | 35,427 | |
Single Male w/Child | 79 | 1,257 | 4,725 | |
Single Female w/Child | 921 | 6,264 | 19,726 |
Population Change Last Two Decades - Plus Projection
2000 | % | 2010 | % | 2020 | % | 2030 | |
---|---|---|---|---|---|---|---|
Illinois | 12,419,293 | +3 | 12,830,632 | +12 | 14,316,487 | +6 | 15,138,849 |
Cook County | 5,376,741 | -3 | 5,194,675 | +10 | 5,707,832 | +5 | 5,990,243 |
Total Working Age Population:
Total Households:
Total Working Age Population:
Total Households:
Total Working Age Population:
Total Households: