Commercial Land
1431 West Lake Street Chicago, IL 60607
1431 West Lake Street Chicago, IL 60607

Details & Description
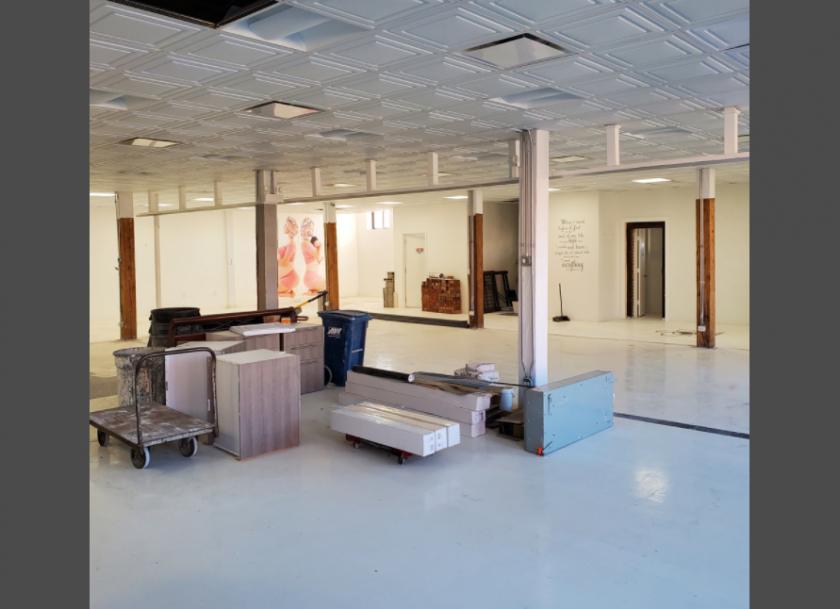
Additional Photos


Listing Agents

Marcus Cook
O: 312-676-1863
M: 224-522-1344
marcus.cook@svn.com
O: 312-676-1863
M: 224-522-1344
marcus.cook@svn.com
While we strive to provide the most accurate information, all listing information, and demographic data, is provided by third-parties. As such, MyEListing will not be responsible for the accuracy of the information. It is strongly recommended that you verify all information with the listing agent, and any relevant agencies, prior to making any decisions.


