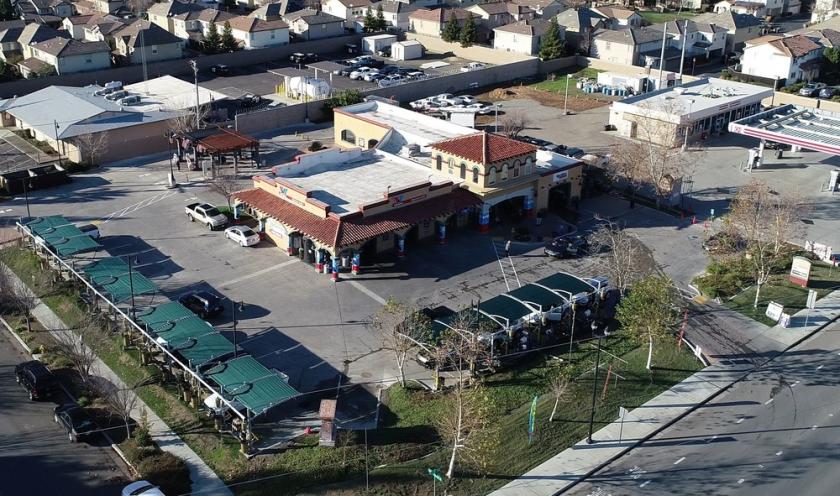
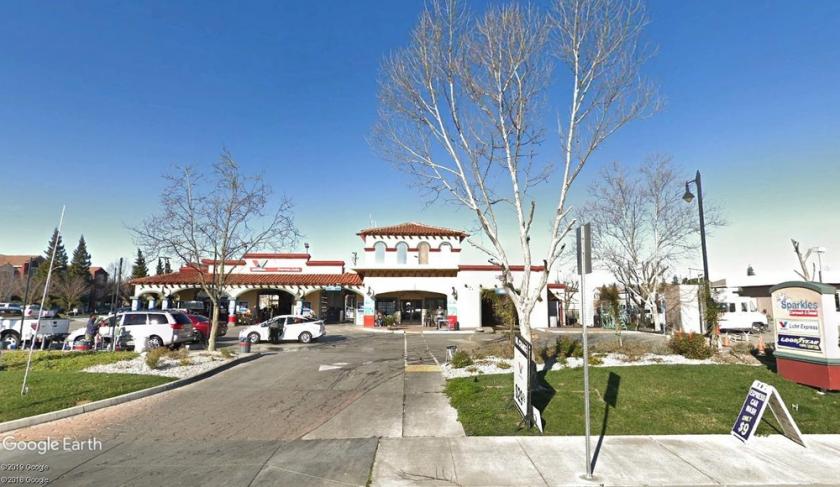
Express and Full service car wash options with a 3 bay quick lube operation.Adjacent to the Woodland Gateway Regional Retail Center with Costco, Target, Best Buy, Dignity Health, and In N Out.Located just off of Interstate 5 on County Rd 102 with 20,000 daily average traffic counts.Upgraded car wash and vacuum systems and equipment to provide low maintenance and continuous daily operation.DescriptionSale Leaseback or Owner User Investment Opportunity: Sparkles Express Car Wash and Quick Lube is part of the $11B Car Wash industry which is expected to continue its growth at an estimate 3.2% annually. The ownership group are open to a complete sale of the business and real estate or to a long term 20 year sale leaseback option. The equipment and systems have been recently upgraded to provide both an express and full service options to satisfy their customers preferences. The Quick Lube provides a one stop shop for customers looking to complete their auto related quick service needs.LocationSparkles Car Wash and Quick Lube is located in the major retail trade area in Woodland, Ca located 15 miles North of Sacramento. This single tenant NNN investment opportunity is adjacent to Interstate 5 across the street from the Woodland Gateway Shopping Center anchored by major retailers Costco, Target, Best Buy, Ulta Beauty, In N Out, and Dignity Health. The high volume of residents and commuters travel along County Rd 102 and Interstate 5 with an average of 77,000 cars per day.