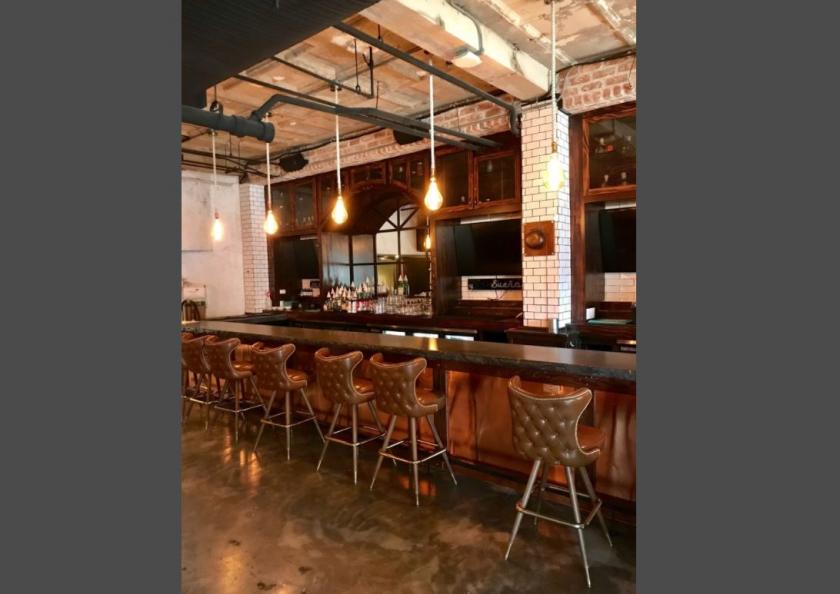
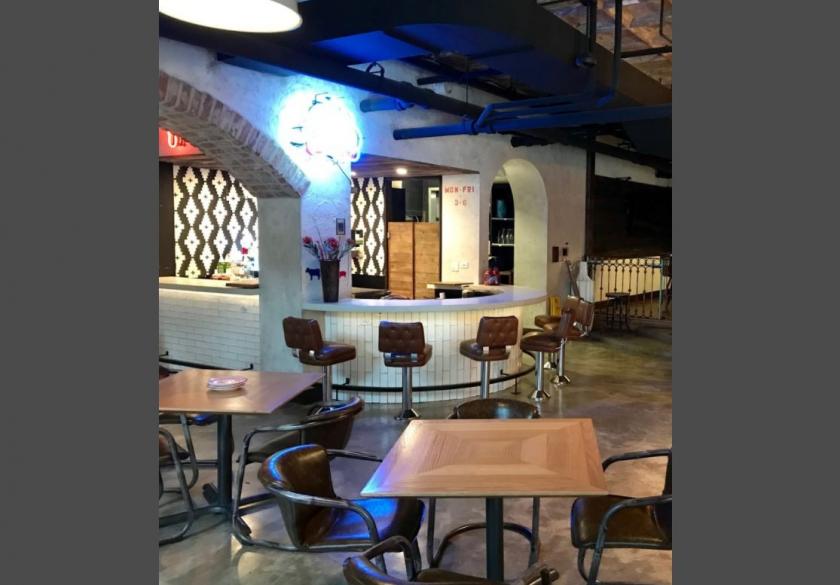
1-Mile | 3-Miles | 5-Miles | ||
---|---|---|---|---|
Total Population | 51,164 | 357,999 | 800,058 | |
Population Median Age | 37 | 38 | 36 | |
Population by Age | 0-9 Yrs | 3336 (6%) | 26401 (7%) | 76806 (9%) |
10-19 Yrs | 4204 (8%) | 26066 (7%) | 70682 (8%) | |
20-29 Yrs | 11793 (23%) | 83931 (23%) | 188111 (23%) | |
30-39 Yrs | 12216 (23%) | 78206 (21%) | 163992 (20%) | |
40-49 Yrs | 6117 (11%) | 40190 (11%) | 91560 (11%) | |
50-59 Yrs | 6372 (12%) | 39202 (10%) | 80401 (10%) | |
60-69 Yrs | 3912 (7%) | 36979 (10%) | 72140 (9%) | |
70+ Yrs | 3214 (6%) | 27024 (7%) | 56365 (7%) | |
Median HH Income | $106,167 | $92,743 | $77,474 | |
Total Household Income | < 24K | 4296 (16%) | 34258 (18%) | 79293 (21%) |
25-49K | 2044 (7%) | 20547 (11%) | 53286 (14%) | |
50-74K | 3090 (11%) | 22559 (12%) | 47981 (12%) | |
75-99K | 3252 (12%) | 20629 (11%) | 40321 (10%) | |
100-199K | 8706 (32%) | 50703 (27%) | 90894 (24%) | |
200K+ | 5268 (19%) | 35316 (19%) | 57330 (15%) | |
Highest Education Level | No Diploma | 1859 | 21268 | 65116 |
Diploma or GED | 2646 | 27684 | 83264 | |
Some College | 3924 | 30526 | 69351 | |
Assoc. Degree | 1649 | 9114 | 22731 | |
Bachelors Degree | 12856 | 94407 | 183832 | |
Higher Degree | 16573 | 93204 | 158564 | |
Total Housing Units | 29,911 | 211,609 | 421,532 | |
--Owner-Occupied | 12,586 | 72,171 | 137,993 | |
--Renter-Occupied | 14,069 | 111,840 | 231,112 | |
Owner-Occupied Values | < 100K | 195 | 1852 | 6030 |
100-199K | 488 | 4647 | 17637 | |
200-299K | 2411 | 13290 | 25279 | |
300-399K | 3715 | 14521 | 23050 | |
400-499K | 2286 | 11290 | 18308 | |
500K+ | 3490 | 26571 | 47687 | |
Total Working Age Population | 46,490 | 319,849 | 685,336 | |
In Work Force | 34,159 | 229,869 | 478,327 | |
Not In Work Force | 12,330 | 89,980 | 207,009 | |
Workforce Employed | 32,928 | 219,045 | 450,276 | |
Workforce Unemployed | 1,083 | 10,593 | 27,605 | |
Civlian Workforce | 34,011 | 229,637 | 477,882 | |
Military Workforce | 148 | 232 | 445 | |
Total Households | 26,655 | 184,012 | 369,105 | |
Family Households | 10,259 | 71,809 | 155,908 | |
Non-Family Households | 16,396 | 112,203 | 213,197 | |
Married Couple | 8,357 | 54,453 | 105,254 | |
Other Family | 1,902 | 17,356 | 50,654 | |
Married w/Child | 2,121 | 15,016 | 36,094 | |
Single Male w/Child | 51 | 1,279 | 4,492 | |
Single Female w/Child | 806 | 6,015 | 19,290 |
Population Change Last Two Decades - Plus Projection
2000 | % | 2010 | % | 2020 | % | 2030 | |
---|---|---|---|---|---|---|---|
Illinois | 12,419,293 | +3 | 12,830,632 | +12 | 14,316,487 | +6 | 15,138,849 |
Cook County | 5,376,741 | -3 | 5,194,675 | +10 | 5,707,832 | +5 | 5,990,243 |
Total Working Age Population:
Total Households:
Total Working Age Population:
Total Households:
Total Working Age Population:
Total Households: