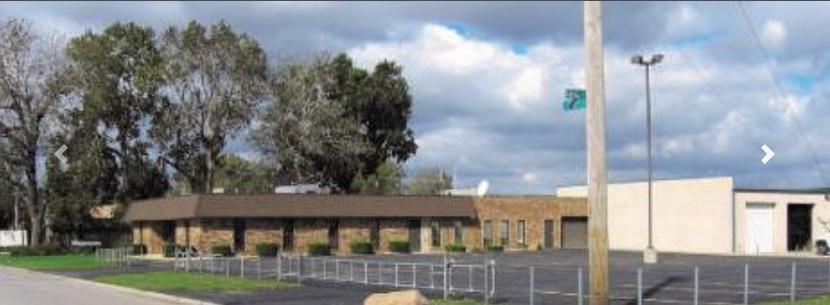
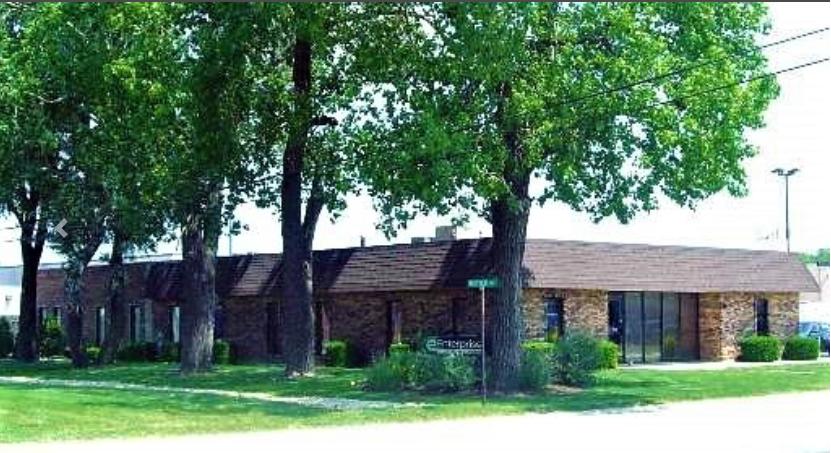
1-Mile | 3-Miles | 5-Miles | ||
---|---|---|---|---|
Total Population | 3,743 | 77,268 | 236,294 | |
Population Median Age | 39 | 39 | 38 | |
Population by Age | 0-9 Yrs | 353 (9%) | 9119 (11%) | 30342 (12%) |
10-19 Yrs | 652 (17%) | 12188 (15%) | 36763 (15%) | |
20-29 Yrs | 562 (15%) | 10328 (13%) | 31250 (13%) | |
30-39 Yrs | 311 (8%) | 8460 (10%) | 26628 (11%) | |
40-49 Yrs | 538 (14%) | 9449 (12%) | 30375 (12%) | |
50-59 Yrs | 489 (13%) | 10384 (13%) | 31009 (13%) | |
60-69 Yrs | 385 (10%) | 9156 (11%) | 26798 (11%) | |
70+ Yrs | 453 (12%) | 8184 (10%) | 23130 (9%) | |
Median HH Income | $47,071 | $53,154 | $51,789 | |
Total Household Income | < 24K | 337 (24%) | 6722 (24%) | 20681 (24%) |
25-49K | 379 (27%) | 6170 (22%) | 20315 (24%) | |
50-74K | 280 (20%) | 5084 (18%) | 14696 (17%) | |
75-99K | 110 (8%) | 3512 (12%) | 11069 (13%) | |
100-199K | 196 (14%) | 5028 (18%) | 15144 (17%) | |
200K+ | 70 (5%) | 704 (2%) | 2584 (3%) | |
Highest Education Level | No Diploma | 467 | 5719 | 16983 |
Diploma or GED | 780 | 14616 | 43061 | |
Some College | 530 | 13783 | 43987 | |
Assoc. Degree | 131 | 4053 | 12544 | |
Bachelors Degree | 302 | 7721 | 22590 | |
Higher Degree | 218 | 4840 | 14019 | |
Total Housing Units | 1,607 | 31,479 | 96,944 | |
--Owner-Occupied | 945 | 19,110 | 55,559 | |
--Renter-Occupied | 427 | 8,112 | 28,930 | |
Owner-Occupied Values | < 100K | 471 | 7322 | 20756 |
100-199K | 431 | 9430 | 26793 | |
200-299K | 37 | 1830 | 5458 | |
300-399K | 4 | 312 | 1495 | |
400-499K | 0 | 66 | 467 | |
500K+ | 2 | 150 | 589 | |
Total Working Age Population | 2,957 | 60,617 | 183,747 | |
In Work Force | 1,821 | 37,707 | 115,868 | |
Not In Work Force | 1,137 | 22,910 | 67,880 | |
Workforce Employed | 1,554 | 33,250 | 100,794 | |
Workforce Unemployed | 267 | 4,440 | 14,937 | |
Civlian Workforce | 1,821 | 37,690 | 115,731 | |
Military Workforce | 0 | 17 | 136 | |
Total Households | 1,372 | 27,222 | 84,488 | |
Family Households | 832 | 18,282 | 55,816 | |
Non-Family Households | 540 | 8,940 | 28,673 | |
Married Couple | 433 | 9,826 | 29,163 | |
Other Family | 399 | 8,456 | 26,653 | |
Married w/Child | 158 | 3,324 | 10,385 | |
Single Male w/Child | 7 | 526 | 2,338 | |
Single Female w/Child | 154 | 3,333 | 10,748 |
Population Change Last Two Decades - Plus Projection
2000 | % | 2010 | % | 2020 | % | 2030 | |
---|---|---|---|---|---|---|---|
Illinois | 12,419,293 | +3 | 12,830,632 | +12 | 14,316,487 | +6 | 15,138,849 |
Cook County | 5,376,741 | -3 | 5,194,675 | +10 | 5,707,832 | +5 | 5,990,243 |
Will County | 502,266 | +35 | 677,560 | +34 | 907,625 | +20 | 1,093,207 |
Total Working Age Population:
Total Households:
Total Working Age Population:
Total Households:
Total Working Age Population:
Total Households: