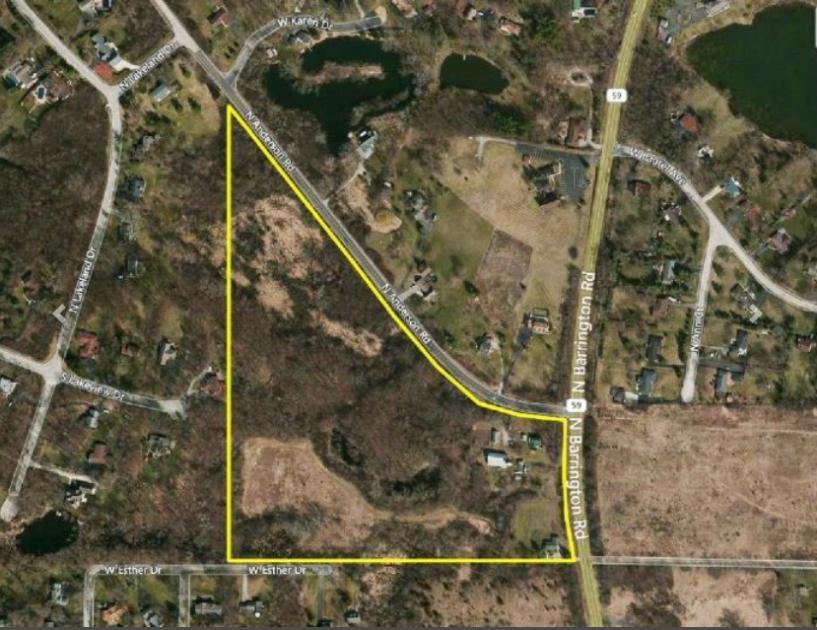
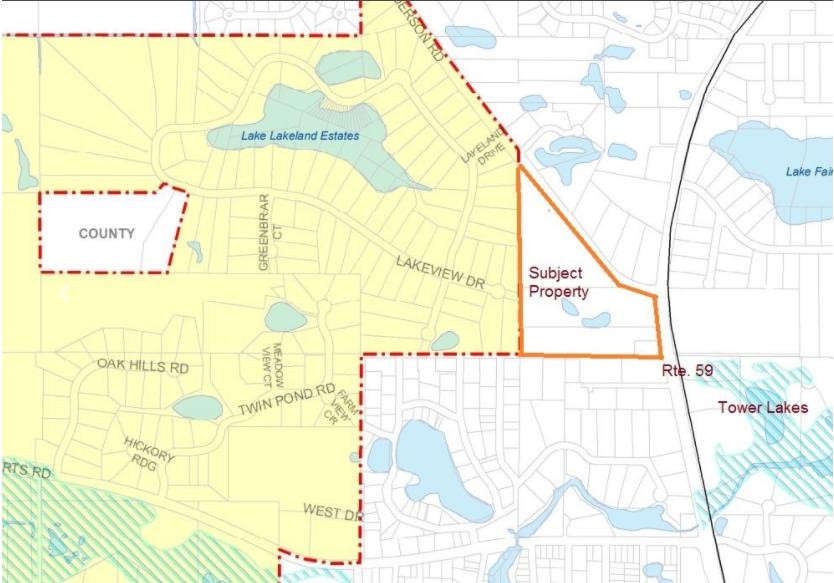
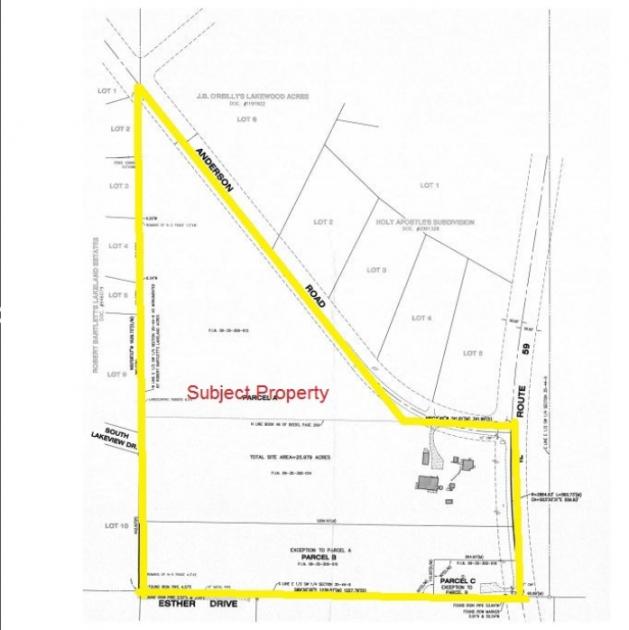
SVN Chicago Commercial is pleased to present a land development opportunity of 25.9 +/- acres of land in the very desirable adjacent areas of Lake Barrington and Tower Lakes. The land is presently in unincorporated Lake County and is zoned E (Estates). The property sits in Tower Lakes master's comprehensive zone plan.
Presently water is on Route 59, but sewer needs will be handled by septic fields. Presently the majority of the 25 acres sits in a Forest Conservatory which equates to low real estate taxes.
The property is surrounded by the communities of Lake Barrington, Tower Lakes, Wacunda and close by Barrington.
Highlights
Great location adjacent to Lake Barrington, Tower Lakes
Water is along frontage on Route 59
Anderson road leads to upscale residential developments within Lake Barrington
High visibility on Route 59 with 560 Feet of Frontage
South Adjacent 4 acre site annexed into Tower Lakes
Property features low taxes due to being in Forest Conservatory
No part of this information may be copied, reproduced, repurposed, or screen-captured for any commercial purpose without prior written authorization from MyEListing.
While we strive to provide the most accurate information, all listing information, and demographic data, is provided by third-parties. As such, MyEListing will not be responsible for the accuracy of the information. It is strongly recommended that you verify all information with the listing agent, and any relevant agencies, prior to making any decisions.
What is the asking price for 26238 Illinois Route 59 in Wauconda?
The asking price for 26238 Illinois Route 59 is $695,000
How much land does the Wauconda, IL property at 26238 Illinois Route 59 include?
26238 Illinois Route 59 in Wauconda includes 25.900 acres of land
What kind of Land is the propery at 26238 Illinois Route 59?
The property at 26238 Illinois Route 59 Wauconda, IL 60084 is listed as a Mixed Use Land Land property
What is the population within 1 mile of 26238 Illinois Route 59 in Wauconda?
The population within 1 mile of 26238 Illinois Route 59 Wauconda, IL 60084 is 3,443 people.
Who do I contact for questions about 26238 Illinois Route 59?
You should contact the listing agent,
Nicholas Manganais, for any details regarding this commercial listing.