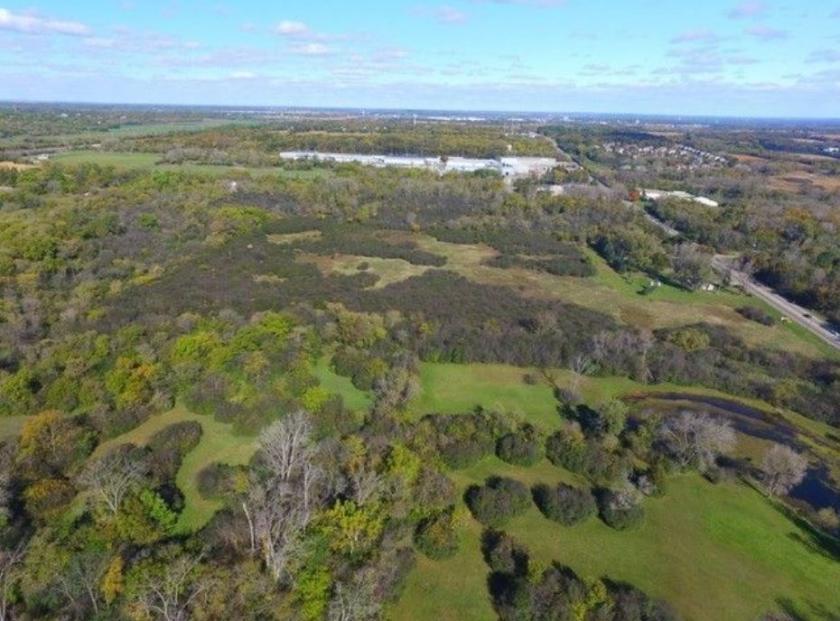
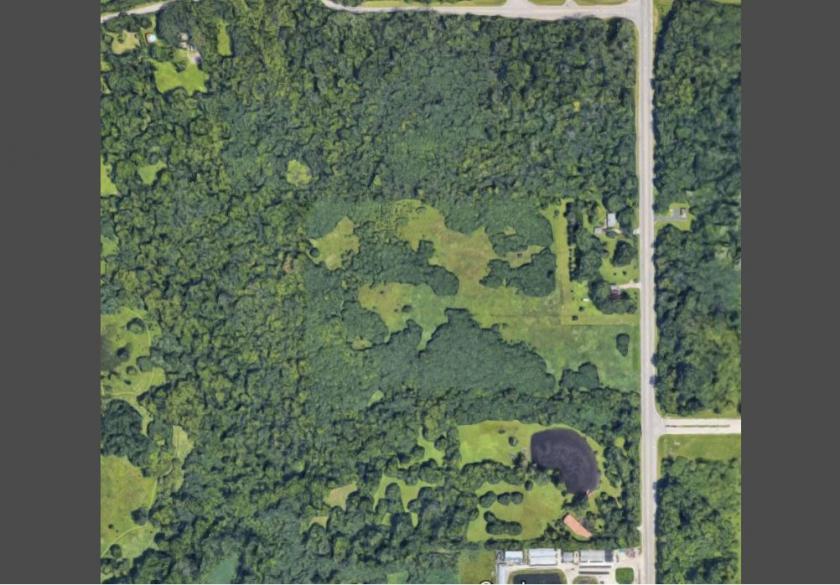
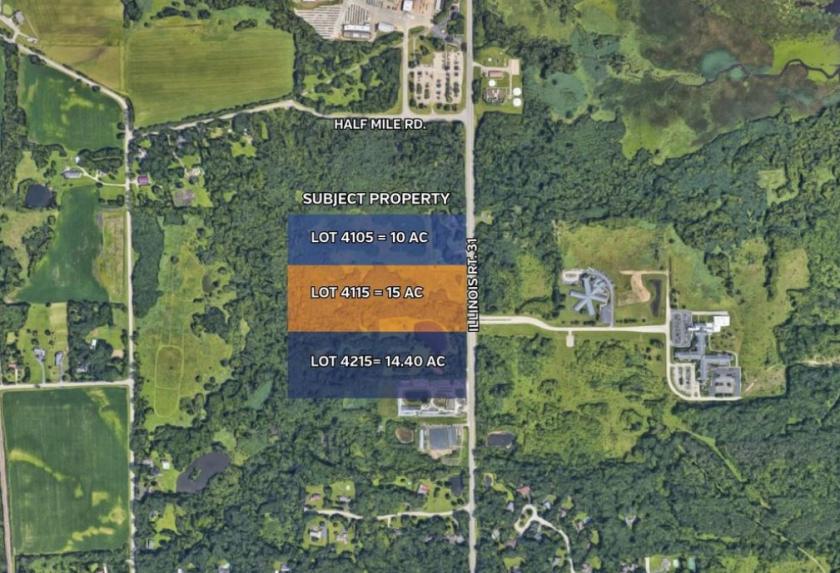
1-Mile | 3-Miles | 5-Miles | ||
---|---|---|---|---|
Total Population | 3,010 | 31,514 | 100,636 | |
Population Median Age | 41 | 39 | 39 | |
Population by Age | 0-9 Yrs | 301 (10%) | 3589 (11%) | 11752 (11%) |
10-19 Yrs | 477 (15%) | 4564 (14%) | 13213 (13%) | |
20-29 Yrs | 245 (8%) | 3683 (11%) | 12156 (12%) | |
30-39 Yrs | 307 (10%) | 3625 (11%) | 12458 (12%) | |
40-49 Yrs | 399 (13%) | 4216 (13%) | 13311 (13%) | |
50-59 Yrs | 596 (19%) | 5485 (17%) | 17705 (17%) | |
60-69 Yrs | 382 (12%) | 3469 (11%) | 11341 (11%) | |
70+ Yrs | 304 (10%) | 2884 (9%) | 8700 (8%) | |
Median HH Income | $99,256 | $91,863 | $89,628 | |
Total Household Income | < 24K | 76 (7%) | 1082 (9%) | 2986 (8%) |
25-49K | 138 (12%) | 1825 (15%) | 5806 (15%) | |
50-74K | 165 (15%) | 1772 (15%) | 6358 (17%) | |
75-99K | 166 (15%) | 1639 (14%) | 5788 (15%) | |
100-199K | 396 (36%) | 3923 (33%) | 12324 (33%) | |
200K+ | 138 (12%) | 1328 (11%) | 3811 (10%) | |
Highest Education Level | No Diploma | 108 | 1153 | 3693 |
Diploma or GED | 417 | 4758 | 16516 | |
Some College | 442 | 4323 | 15823 | |
Assoc. Degree | 186 | 2150 | 6904 | |
Bachelors Degree | 638 | 5707 | 17662 | |
Higher Degree | 316 | 3515 | 8742 | |
Total Housing Units | 1,136 | 12,173 | 38,986 | |
--Owner-Occupied | 851 | 9,251 | 29,751 | |
--Renter-Occupied | 228 | 2,317 | 7,321 | |
Owner-Occupied Values | < 100K | 20 | 613 | 1811 |
100-199K | 205 | 2648 | 10463 | |
200-299K | 276 | 3254 | 10497 | |
300-399K | 242 | 1765 | 4303 | |
400-499K | 59 | 555 | 1473 | |
500K+ | 49 | 416 | 1204 | |
Total Working Age Population | 2,391 | 25,025 | 80,716 | |
In Work Force | 1,618 | 17,775 | 58,010 | |
Not In Work Force | 774 | 7,250 | 22,706 | |
Workforce Employed | 1,529 | 17,028 | 55,621 | |
Workforce Unemployed | 88 | 748 | 2,380 | |
Civlian Workforce | 1,618 | 17,775 | 58,001 | |
Military Workforce | 0 | 0 | 10 | |
Total Households | 1,079 | 11,568 | 37,073 | |
Family Households | 842 | 8,451 | 27,473 | |
Non-Family Households | 237 | 3,117 | 9,600 | |
Married Couple | 760 | 7,009 | 22,605 | |
Other Family | 82 | 1,443 | 4,868 | |
Married w/Child | 321 | 2,867 | 8,999 | |
Single Male w/Child | 8 | 192 | 709 | |
Single Female w/Child | 15 | 560 | 1,943 |
Population Change Last Two Decades - Plus Projection
2000 | % | 2010 | % | 2020 | % | 2030 | |
---|---|---|---|---|---|---|---|
Illinois | 12,419,293 | +3 | 12,830,632 | +12 | 14,316,487 | +6 | 15,138,849 |
Lake County | 644,356 | +9 | 703,462 | +17 | 820,250 | +6 | 873,024 |
McHenry County | 260,077 | +19 | 308,760 | +32 | 407,931 | +9 | 443,398 |
Total Working Age Population:
Total Households:
Total Working Age Population:
Total Households:
Total Working Age Population:
Total Households: