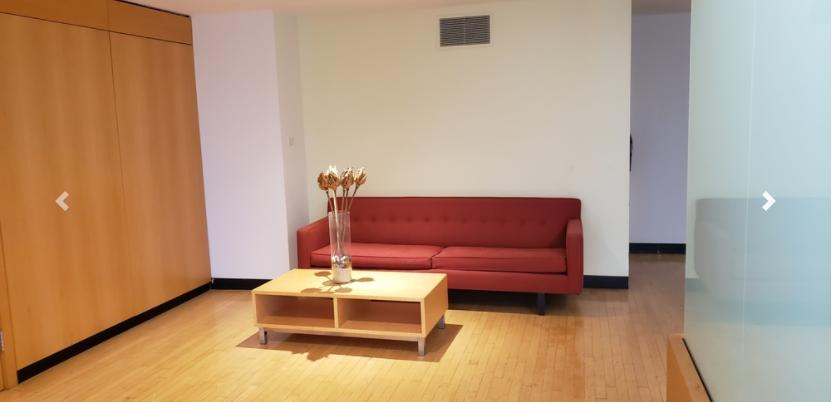
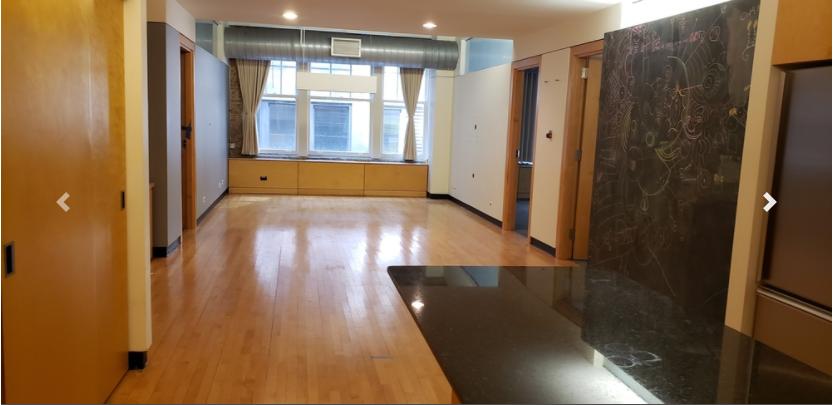
SVN Chicago Commercial is pleased to present, for the first time in nearly a century, the opportunity to acquire 232 E Ohio, in Chicago’s incredible Streeterville neighborhood. Built-in 1917, this vintage property consists of approx. 29,500 SF brick office building on an approx. 7,841 SF land site, which is encompassed by 4 stories + a lower level of rentable office space. The building is the long-time home of CRC Recording Studios who currently occupies the 1st, 2nd, and lower-level spaces.
Substantial upside exists as a continued office property via leasing up the vacant 3rd and 4th floors and increasing rents on the currently occupied space as the lease is at below-market rents for the area. Additional opportunity exists in the land value of the property, which possesses DX-7 zoning, allowing for a total of 12X the land site (approx 94,000 SF buildable) without any zoning variance, selling the air rights, or adding floors onto the existing structure.
The property is approximately 55% leased to a long term tenant, presenting an investor with a stable cash flow while pursuing lease-up of the vacant space or re-development of the entire site. It would also be a perfect building for an owner/user to occupy the top two floors and maintain the rental income from the existing tenant. Zoning allows for just about any possible uses including multi-family, retail, office, or hotel/hospitality.
APPROX. 29,500 SF OFFICE BUILDING ON 7,841 SF LAND SITE
DX-12 ZONING ALLOWS FOR DEVELOPMENT OF +/- 94,092 SF
HIGH PROFILE STREETERVILLE LOCATION
DESIRABLE HISTORIC LOFT STYLE BUILDING
IN-PLACE INCOME PROVIDES STABILITY DURING RE-TENANTING OR RE-DEVELOPMENT
STEPS TO MICHIGAN AVE "MAGNIFICENT MILE" SHOPPING & RESTAURANTS
ADJACENT TO NORTHWESTERN UNIVERSITY GRADUATE SCHOOLS AND HOSPITALS
SURROUNDED BY NOTABLE OFFICE TENANTS, RETAILERS & MANY NEW OFFICE, HOTEL & RESIDENTIAL DEVELOPMENTS
OFFERED FOR SALE AT $6.5 MILLION