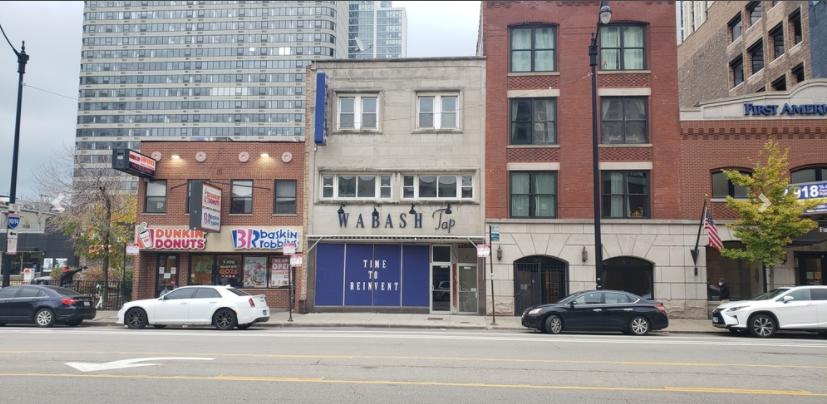
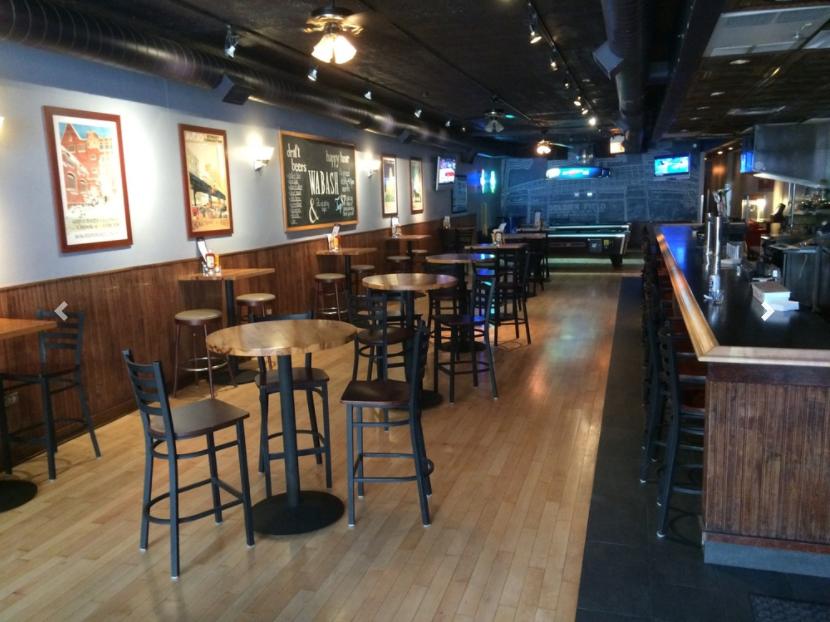
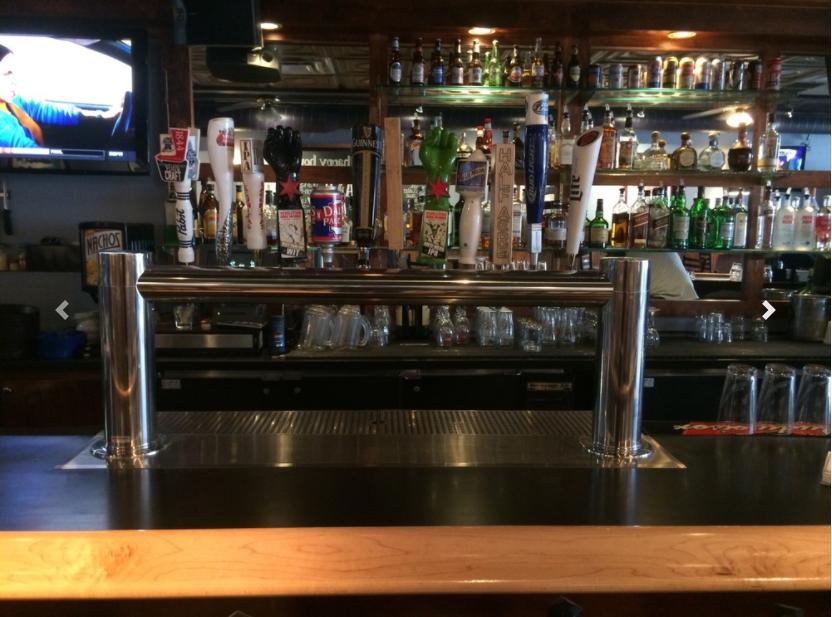
Incredible opportunity to acquire a historic bar/restaurant building with substantial air rights in the middle of Chicago's vibrant South Loop/Roosevelt Road corridor. Located at the high-profile Wabash & Roosevelt intersection, this approx. 9,975 SF building was the long time home of the Wabash Tap, and previously was Koko Taylor's blues club. The 4,275 SF ground floor is a 2nd generation bar/restaurant with substantial infrastructure and equipment for a new operator. The upper two floors could be re-positioned as either apartments or office space.
DX-7 zoning allows for a complete re-development of up to +/- 30,000 buildable SF and is located in a Transit-Oriented Development (TOD) area allowing for reduced/limited parking. The site has potential for residential, mixed-use, hotel/hospitality, office, or retail/restaurant development. One of the busiest locations in Chicago, the property is one block from the Roosevelt CTA station, which boasts over 3.8 million riders annually. Offered for sale at $2,400,000. The ground floor restaurant space is also available for lease at $35/sf NNN.
Highlights
9,975 SF mixed-use building on 4,275 SF land site
Existing building with ground floor bar/restaurant + apartment/office space on 2nd & 3rd floors &1 car garage
Located in Chicago's South Loop / Roosevelt Road Corridor
Incredibly high-traffic location - next to Soldier Field, Grant Park, Museum Campus, downtown Universities
and schools
1 block to Roosevelt CTA station with over 3.8 million annual riders
DX-7 Zoning allows for approx. 30,000 buildable SF
TOD suitable development site due to proximity to CTA trains
Steps to thousands of area residents and hotel rooms
Seconds to Lake Shore Drive and proximate to all expressways
Many possible uses including restaurant, residential, hotel, office, mixed-use, and retail
Great immediate aea co-tenancy including Trader Joe's, Starbucks, Jewel Osco, Walgreens, Target, Five Guys, Stan's Donuts & Potbelly
Ground floor bar/restaurant also available for lease