Specialty Real Estate
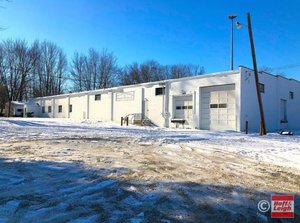
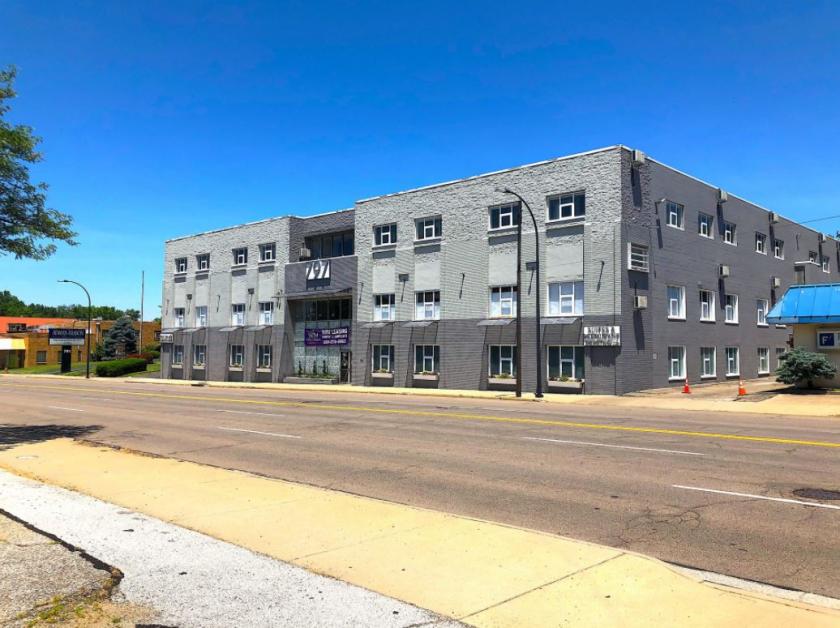
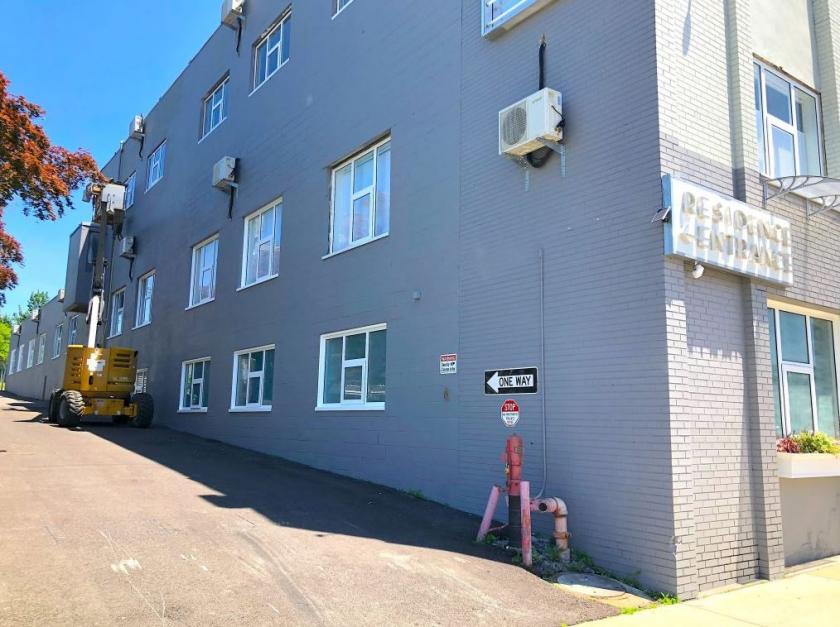
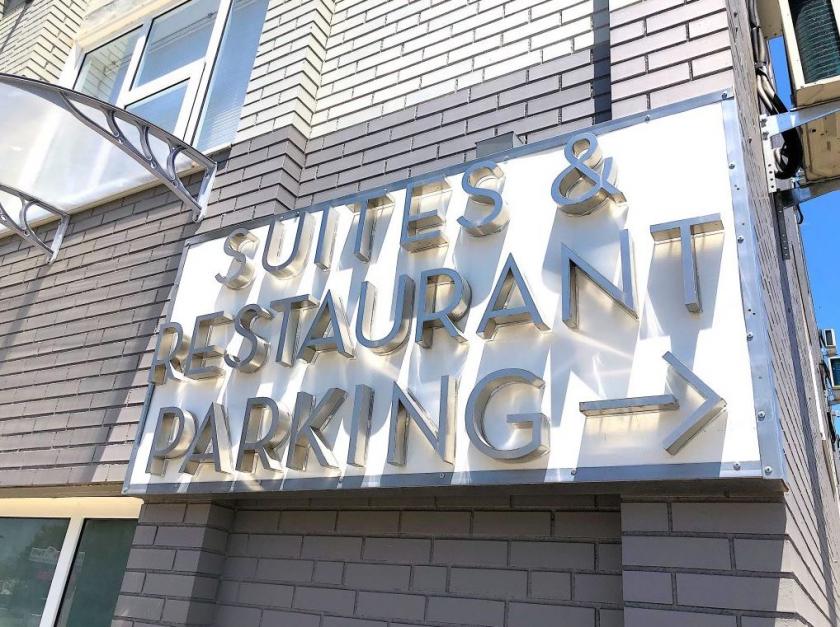
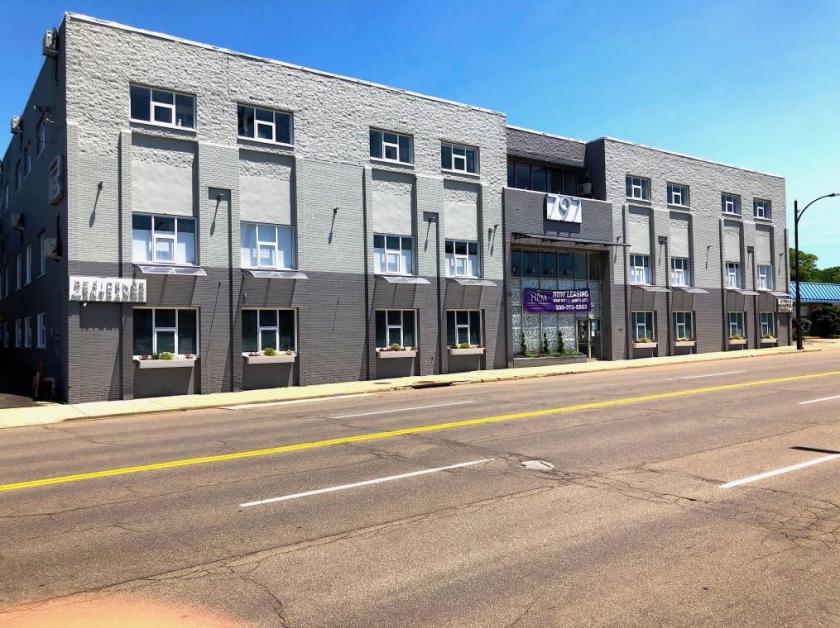
797 East Market Street Akron, OH 44305
797 East Market Street Akron, OH 44305
Details & Description
Additional Photos
Listing Agents

TJ Hollin
O: 330-940-9360
M: 330-618-8045
tjhollin@hoffleigh.com
O: 330-940-9360
M: 330-618-8045
tjhollin@hoffleigh.com
While we strive to provide the most accurate information, all listing information, and demographic data, is provided by third-parties. As such, MyEListing will not be responsible for the accuracy of the information. It is strongly recommended that you verify all information with the listing agent, and any relevant agencies, prior to making any decisions.