Industrial Properties
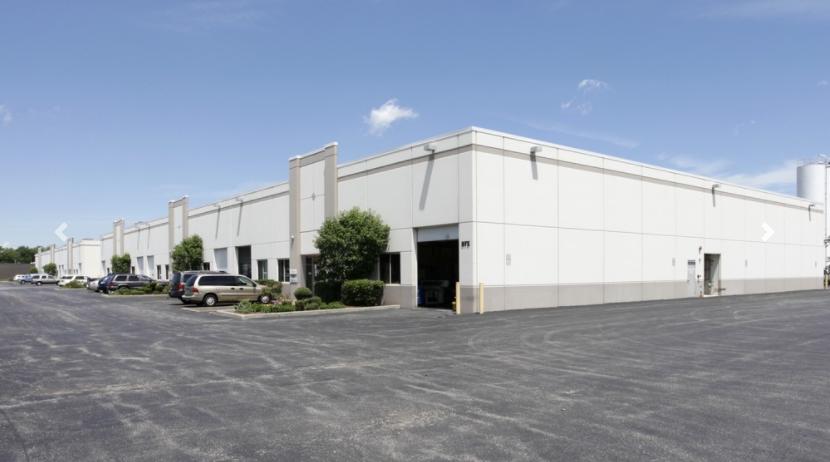
975 Nimco Drive Crystal Lake, IL 60014
975 Nimco Drive Crystal Lake, IL 60014

Details & Description
Listing Agents

Daniel Tobin
SVN Commercial Real Estate Adv
O: 847-867-2739
M: 847-464-8467
dan.tobin@svn.com
SVN Commercial Real Estate Adv
O: 847-867-2739
M: 847-464-8467
dan.tobin@svn.com
While we strive to provide the most accurate information, all listing information, and demographic data, is provided by third-parties. As such, MyEListing will not be responsible for the accuracy of the information. It is strongly recommended that you verify all information with the listing agent, and any relevant agencies, prior to making any decisions.