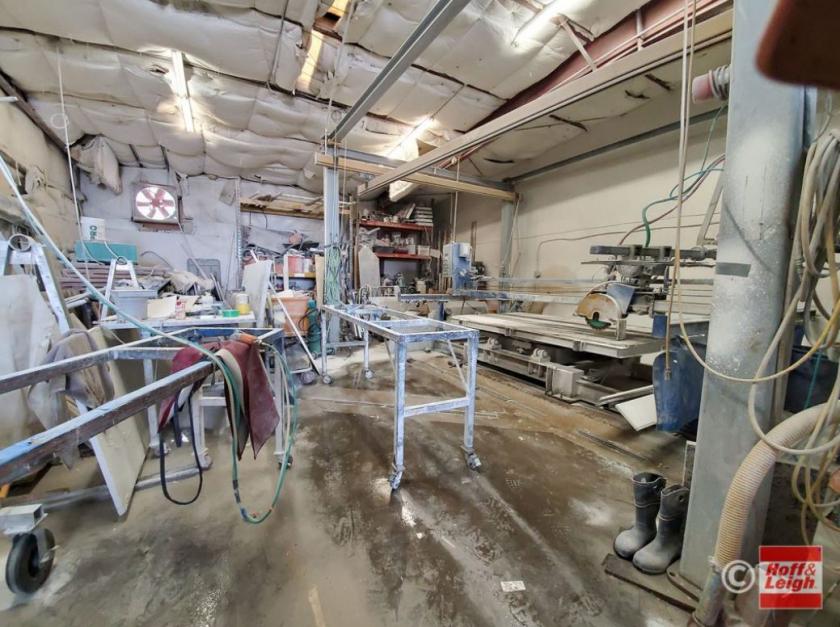
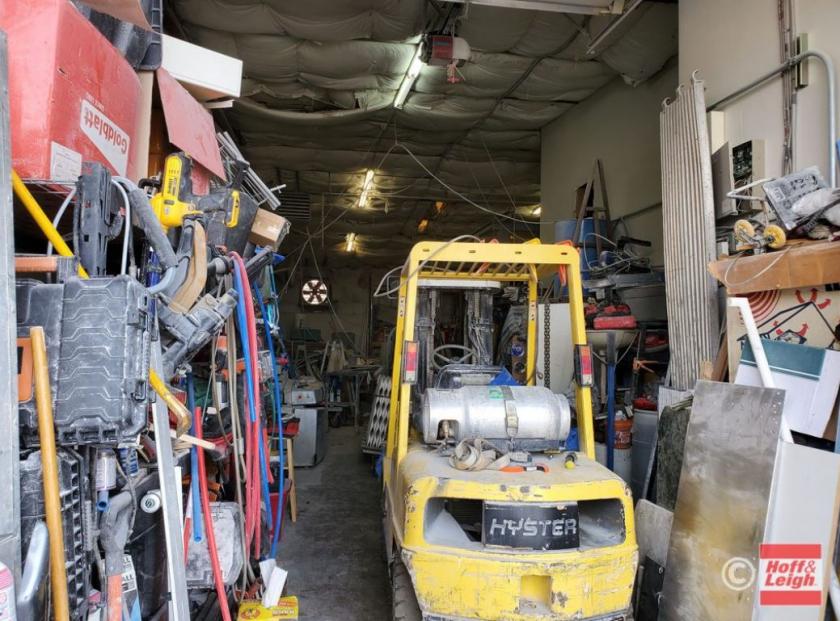
1-Mile | 3-Miles | 5-Miles | ||
---|---|---|---|---|
Total Population | 2,636 | 62,632 | 190,452 | |
Population Median Age | 50 | 41 | 40 | |
Population by Age | 0-9 Yrs | 190 (7%) | 7004 (11%) | 21314 (11%) |
10-19 Yrs | 293 (11%) | 8260 (13%) | 24512 (12%) | |
20-29 Yrs | 167 (6%) | 5711 (9%) | 20322 (10%) | |
30-39 Yrs | 243 (9%) | 7896 (12%) | 24496 (12%) | |
40-49 Yrs | 321 (12%) | 9236 (14%) | 27128 (14%) | |
50-59 Yrs | 345 (13%) | 10127 (16%) | 28279 (14%) | |
60-69 Yrs | 249 (9%) | 7632 (12%) | 24458 (12%) | |
70+ Yrs | 828 (31%) | 6766 (10%) | 19941 (10%) | |
Median HH Income | $83,637 | $107,606 | $98,530 | |
Total Household Income | < 24K | 118 (9%) | 1644 (6%) | 6509 (8%) |
25-49K | 223 (17%) | 2729 (11%) | 10245 (13%) | |
50-74K | 260 (19%) | 3479 (14%) | 11039 (14%) | |
75-99K | 155 (11%) | 3498 (14%) | 10482 (13%) | |
100-199K | 377 (28%) | 9630 (38%) | 26758 (35%) | |
200K+ | 177 (13%) | 3770 (15%) | 10287 (13%) | |
Highest Education Level | No Diploma | 68 | 750 | 3979 |
Diploma or GED | 224 | 6274 | 20122 | |
Some College | 330 | 8485 | 27766 | |
Assoc. Degree | 111 | 3632 | 10927 | |
Bachelors Degree | 821 | 16467 | 46805 | |
Higher Degree | 507 | 9184 | 26008 | |
Total Housing Units | 1,338 | 25,235 | 77,299 | |
--Owner-Occupied | 714 | 19,323 | 57,922 | |
--Renter-Occupied | 597 | 5,428 | 17,399 | |
Owner-Occupied Values | < 100K | 33 | 534 | 1021 |
100-199K | 27 | 455 | 2330 | |
200-299K | 72 | 1896 | 8192 | |
300-399K | 136 | 4765 | 13979 | |
400-499K | 151 | 5873 | 15763 | |
500K+ | 295 | 5800 | 16635 | |
Total Working Age Population | 2,272 | 50,535 | 153,688 | |
In Work Force | 1,117 | 35,263 | 107,857 | |
Not In Work Force | 1,155 | 15,272 | 45,830 | |
Workforce Employed | 1,057 | 34,213 | 104,520 | |
Workforce Unemployed | 60 | 1,031 | 3,255 | |
Civlian Workforce | 1,117 | 35,244 | 107,776 | |
Military Workforce | 0 | 19 | 82 | |
Total Households | 1,311 | 24,750 | 75,321 | |
Family Households | 671 | 18,144 | 52,799 | |
Non-Family Households | 640 | 6,606 | 22,521 | |
Married Couple | 582 | 15,164 | 43,386 | |
Other Family | 89 | 2,980 | 9,413 | |
Married w/Child | 179 | 6,146 | 17,438 | |
Single Male w/Child | 33 | 636 | 1,814 | |
Single Female w/Child | 29 | 877 | 3,030 |
Population Change Last Two Decades - Plus Projection
2000 | % | 2010 | % | 2020 | % | 2030 | |
---|---|---|---|---|---|---|---|
Colorado | 4,301,261 | +17 | 5,029,196 | +16 | 5,838,181 | +15 | 6,733,658 |
Arapahoe County | 487,967 | +17 | 572,003 | +16 | 662,304 | +13 | 750,773 |
Denver County | 554,636 | +8 | 600,158 | +23 | 738,611 | +12 | 827,681 |
Douglas County | 175,766 | +62 | 285,465 | +23 | 350,161 | +16 | 405,087 |
Jefferson County | 527,056 | +1 | 534,543 | +10 | 587,118 | +7 | 626,742 |
Total Working Age Population:
Total Households:
Total Working Age Population:
Total Households:
Total Working Age Population:
Total Households: