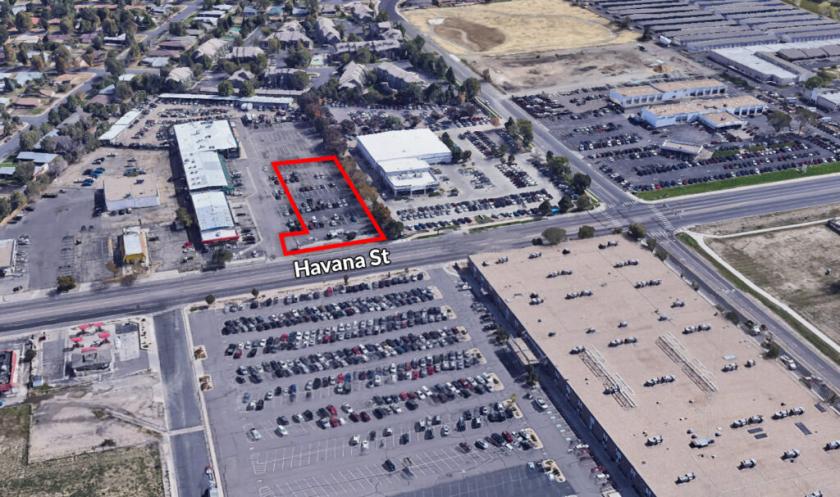
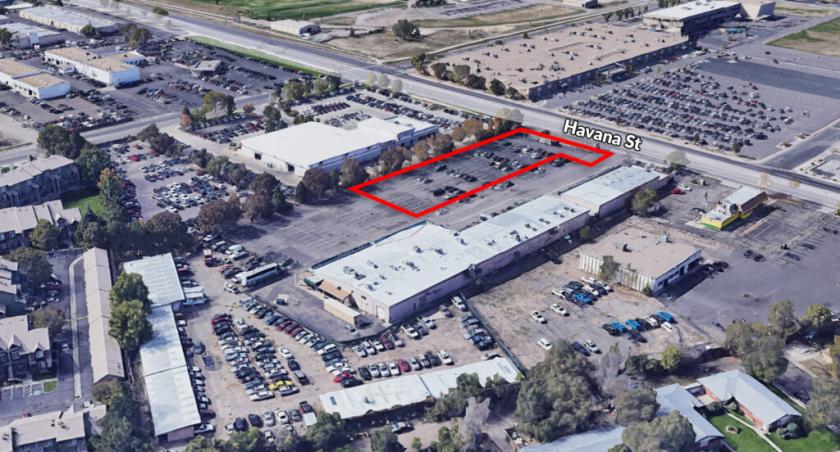
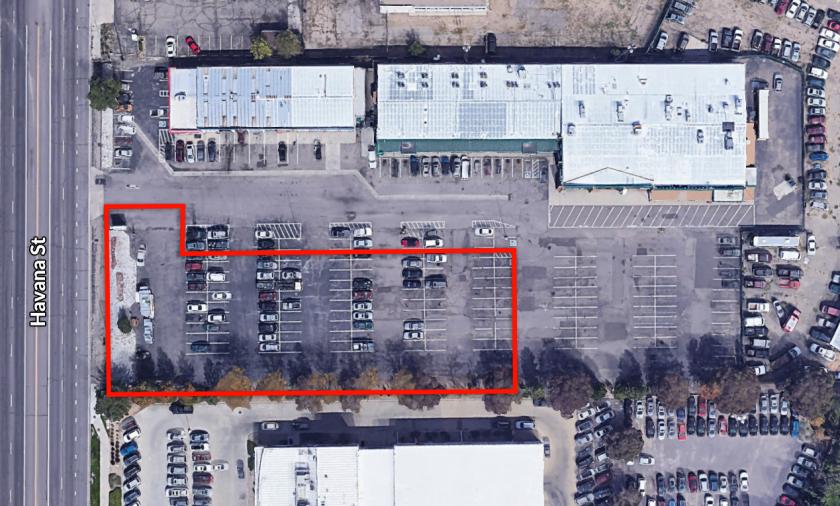
1-Mile | 3-Miles | 5-Miles | ||
---|---|---|---|---|
Total Population | 22,605 | 193,714 | 455,446 | |
Population Median Age | 34 | 36 | 37 | |
Population by Age | 0-9 Yrs | 3077 (13%) | 26590 (13%) | 60183 (13%) |
10-19 Yrs | 3341 (14%) | 23567 (12%) | 51148 (11%) | |
20-29 Yrs | 4028 (17%) | 33387 (17%) | 74727 (16%) | |
30-39 Yrs | 3787 (16%) | 31652 (16%) | 78500 (17%) | |
40-49 Yrs | 3063 (13%) | 26963 (13%) | 62180 (13%) | |
50-59 Yrs | 2269 (10%) | 20521 (10%) | 49576 (10%) | |
60-69 Yrs | 1724 (7%) | 16163 (8%) | 41525 (9%) | |
70+ Yrs | 1316 (5%) | 14871 (7%) | 37607 (8%) | |
Median HH Income | $52,088 | $54,766 | $60,769 | |
Total Household Income | < 24K | 1780 (22%) | 14675 (19%) | 30669 (16%) |
25-49K | 2060 (25%) | 19645 (26%) | 43191 (23%) | |
50-74K | 1586 (19%) | 14077 (18%) | 34975 (19%) | |
75-99K | 956 (11%) | 9898 (13%) | 23700 (12%) | |
100-199K | 1417 (17%) | 12897 (17%) | 36143 (19%) | |
200K+ | 170 (2%) | 3731 (4%) | 13876 (7%) | |
Highest Education Level | No Diploma | 2646 | 20093 | 37442 |
Diploma or GED | 3990 | 31189 | 68108 | |
Some College | 3017 | 24263 | 58621 | |
Assoc. Degree | 1282 | 9667 | 22556 | |
Bachelors Degree | 2324 | 26116 | 76749 | |
Higher Degree | 1045 | 17536 | 50805 | |
Total Housing Units | 8,464 | 79,384 | 193,919 | |
--Owner-Occupied | 3,148 | 32,767 | 89,748 | |
--Renter-Occupied | 4,820 | 42,156 | 92,807 | |
Owner-Occupied Values | < 100K | 235 | 2082 | 4971 |
100-199K | 740 | 6872 | 14108 | |
200-299K | 1268 | 9791 | 22462 | |
300-399K | 627 | 6137 | 16872 | |
400-499K | 183 | 2820 | 10007 | |
500K+ | 95 | 5065 | 21328 | |
Total Working Age Population | 17,493 | 152,063 | 362,455 | |
In Work Force | 12,566 | 107,112 | 257,129 | |
Not In Work Force | 4,927 | 44,951 | 105,327 | |
Workforce Employed | 11,484 | 101,217 | 244,425 | |
Workforce Unemployed | 1,039 | 5,658 | 11,973 | |
Civlian Workforce | 12,523 | 106,875 | 256,399 | |
Military Workforce | 43 | 237 | 730 | |
Total Households | 7,968 | 74,923 | 182,555 | |
Family Households | 4,533 | 40,740 | 99,166 | |
Non-Family Households | 3,436 | 34,183 | 83,389 | |
Married Couple | 2,565 | 25,968 | 66,978 | |
Other Family | 1,967 | 14,772 | 32,188 | |
Married w/Child | 1,239 | 12,653 | 31,497 | |
Single Male w/Child | 365 | 1,773 | 4,283 | |
Single Female w/Child | 699 | 5,924 | 11,692 |
Population Change Last Two Decades - Plus Projection
2000 | % | 2010 | % | 2020 | % | 2030 | |
---|---|---|---|---|---|---|---|
Colorado | 4,301,261 | +17 | 5,029,196 | +16 | 5,838,181 | +15 | 6,733,658 |
Adams County | 363,857 | +21 | 441,603 | +20 | 530,680 | +21 | 642,318 |
Arapahoe County | 487,967 | +17 | 572,003 | +16 | 662,304 | +13 | 750,773 |
Denver County | 554,636 | +8 | 600,158 | +23 | 738,611 | +12 | 827,681 |
Total Working Age Population:
Total Households:
Total Working Age Population:
Total Households:
Total Working Age Population:
Total Households: