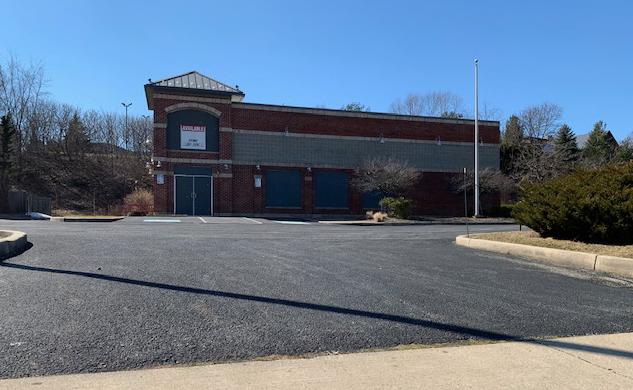
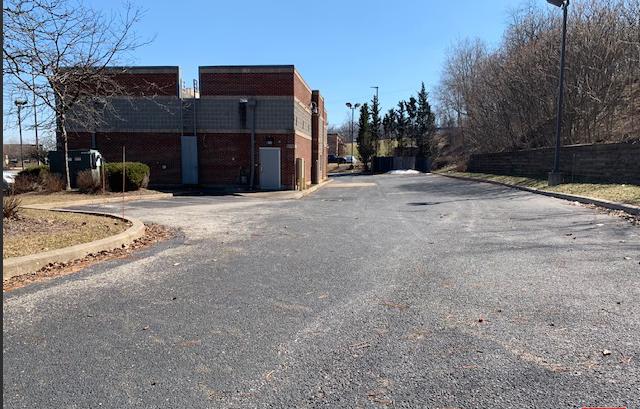
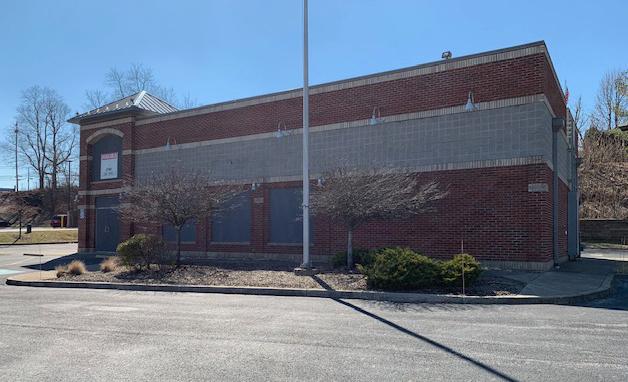
1-Mile | 3-Miles | 5-Miles | ||
---|---|---|---|---|
Total Population | 3,428 | 35,349 | 87,131 | |
Population Median Age | 43 | 41 | 41 | |
Population by Age | 0-9 Yrs | 423 (12%) | 4331 (12%) | 10109 (11%) |
10-19 Yrs | 387 (11%) | 4600 (13%) | 11834 (13%) | |
20-29 Yrs | 381 (11%) | 3172 (8%) | 7435 (8%) | |
30-39 Yrs | 301 (8%) | 4194 (11%) | 9442 (10%) | |
40-49 Yrs | 361 (10%) | 5362 (15%) | 12956 (14%) | |
50-59 Yrs | 520 (15%) | 5330 (15%) | 13557 (15%) | |
60-69 Yrs | 487 (14%) | 4376 (12%) | 11174 (12%) | |
70+ Yrs | 569 (16%) | 3984 (11%) | 10623 (12%) | |
Median HH Income | $55,280 | $89,814 | $90,603 | |
Total Household Income | < 24K | 300 (19%) | 1650 (11%) | 3650 (10%) |
25-49K | 403 (26%) | 2116 (15%) | 5116 (15%) | |
50-74K | 259 (16%) | 1993 (14%) | 5078 (14%) | |
75-99K | 196 (12%) | 2072 (14%) | 4948 (14%) | |
100-199K | 326 (21%) | 4765 (34%) | 10798 (31%) | |
200K+ | 46 (3%) | 1378 (9%) | 4276 (12%) | |
Highest Education Level | No Diploma | 119 | 946 | 2633 |
Diploma or GED | 710 | 5606 | 13344 | |
Some College | 498 | 4642 | 10835 | |
Assoc. Degree | 207 | 2004 | 4667 | |
Bachelors Degree | 601 | 7339 | 17674 | |
Higher Degree | 283 | 4363 | 12274 | |
Total Housing Units | 1,578 | 14,425 | 35,489 | |
--Owner-Occupied | 973 | 11,408 | 27,660 | |
--Renter-Occupied | 557 | 2,566 | 6,206 | |
Owner-Occupied Values | < 100K | 70 | 557 | 1769 |
100-199K | 489 | 3832 | 8780 | |
200-299K | 318 | 4357 | 8833 | |
300-399K | 58 | 1891 | 4637 | |
400-499K | 22 | 506 | 1942 | |
500K+ | 16 | 266 | 1699 | |
Total Working Age Population | 2,774 | 27,975 | 69,550 | |
In Work Force | 1,796 | 19,751 | 47,311 | |
Not In Work Force | 979 | 8,224 | 22,238 | |
Workforce Employed | 1,707 | 19,248 | 45,651 | |
Workforce Unemployed | 88 | 490 | 1,640 | |
Civlian Workforce | 1,796 | 19,738 | 47,291 | |
Military Workforce | 0 | 12 | 20 | |
Total Households | 1,530 | 13,974 | 33,867 | |
Family Households | 927 | 9,856 | 23,979 | |
Non-Family Households | 604 | 4,118 | 9,888 | |
Married Couple | 617 | 8,216 | 20,034 | |
Other Family | 309 | 1,640 | 3,945 | |
Married w/Child | 223 | 3,539 | 8,532 | |
Single Male w/Child | 24 | 192 | 406 | |
Single Female w/Child | 165 | 568 | 1,386 |
Population Change Last Two Decades - Plus Projection
2000 | % | 2010 | % | 2020 | % | 2030 | |
---|---|---|---|---|---|---|---|
Ohio | 11,353,140 | +2 | 11,536,504 | 0 | 11,574,870 | 0 | 11,615,100 |
Cuyahoga County | 1,393,978 | -8 | 1,280,122 | -6 | 1,209,550 | -5 | 1,154,210 |
Geauga County | 90,895 | +3 | 93,389 | 0 | 93,510 | +2 | 94,930 |
Portage County | 152,061 | +6 | 161,419 | 0 | 161,410 | -2 | 158,930 |
Summit County | 542,899 | 0 | 541,781 | -1 | 534,150 | -1 | 528,990 |
Total Working Age Population:
Total Households:
Total Working Age Population:
Total Households:
Total Working Age Population:
Total Households: