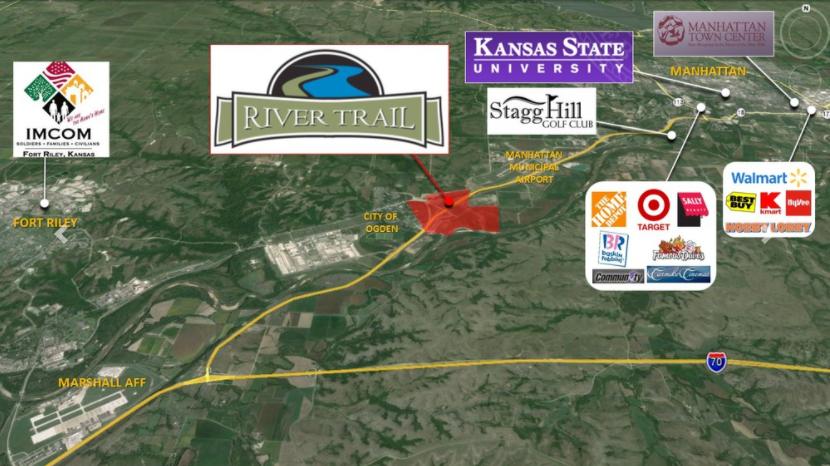
Located in the Heart of the Midwest, River Trail is a 308 acre mixed-use and master planned community that has been years in the making. The Kansas Department of Transportation has just completed a $100 million highway realignment and interchange than runs right through the middle of the River Trail project creating over one mile of highway frontage for the development. Over 40,000 cars per day are already reported. The project is now fully annexed, zoned and platted with all utilities on site. Some streets and utilities are already in with some pad ready residential and commercial sites available immediately.
The Ownership is offering 85% financing to qualified Developers of multi-family ground that may have interest in certain parcels of the project.
The $100 million interchange and the River Trail project were both strategically located in the midst of a growing community that will double in size over the next 6 - 10 years. The project is at the entrance to the main gate of Fort Riley, one of the largest military bases in the country spawning an amazing 100,656 acres and at the entrance to the amazing city of Manhattan, KS known as "The Little Apple".
Highlights
US Govt Has Clearly Chosen the Heart of the Midwest
Top Research Labs in the World are under construction
One of the Main US Military bases rapidly expanding
$100 Million Hwy Realignment & Interchange complete
85% Financing to Qualified Apartment & Comm Developers
No part of this information may be copied, reproduced, repurposed, or screen-captured for any commercial purpose without prior written authorization from MyEListing.
While we strive to provide the most accurate information, all listing information, and demographic data, is provided by third-parties. As such, MyEListing will not be responsible for the accuracy of the information. It is strongly recommended that you verify all information with the listing agent, and any relevant agencies, prior to making any decisions.
How much land does the Ogden, KS property at 606 South Park Street include?
606 South Park Street in Ogden includes 308.000 acres of land
What kind of Land is the propery at 606 South Park Street?
The property at 606 South Park Street Ogden, KS 66517 is listed as a Mixed Use Land Land property
What is the population within 1 mile of 606 South Park Street in Ogden?
The population within 1 mile of 606 South Park Street Ogden, KS 66517 is 358 people.
Who do I contact for questions about 606 South Park Street?
You should contact the listing agent,
Sterling Scott, for any details regarding this commercial listing.