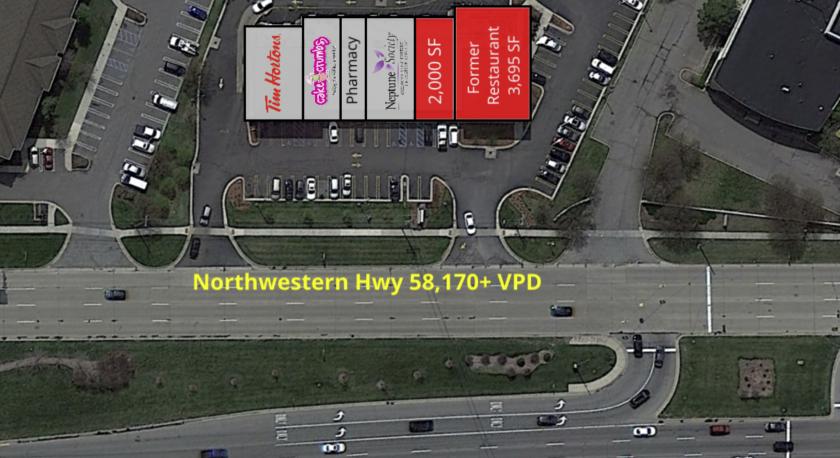
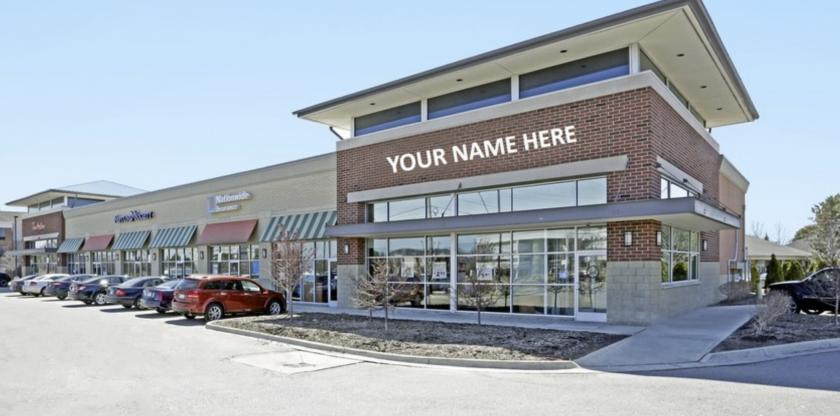
1-Mile | 3-Miles | 5-Miles | ||
---|---|---|---|---|
Total Population | 10,524 | 59,588 | 197,873 | |
Population Median Age | 42 | 44 | 42 | |
Population by Age | 0-9 Yrs | 804 (7%) | 5085 (8%) | 20790 (10%) |
10-19 Yrs | 964 (9%) | 6655 (11%) | 23742 (11%) | |
20-29 Yrs | 2213 (21%) | 7388 (12%) | 23343 (11%) | |
30-39 Yrs | 1282 (12%) | 6374 (10%) | 22048 (11%) | |
40-49 Yrs | 1092 (10%) | 7021 (11%) | 25006 (12%) | |
50-59 Yrs | 1149 (10%) | 8101 (13%) | 28616 (14%) | |
60-69 Yrs | 1442 (13%) | 9087 (15%) | 27460 (13%) | |
70+ Yrs | 1579 (15%) | 9877 (16%) | 26867 (13%) | |
Median HH Income | $45,216 | $67,835 | $70,392 | |
Total Household Income | < 24K | 1520 (26%) | 4569 (17%) | 13508 (16%) |
25-49K | 1641 (28%) | 5282 (20%) | 15935 (19%) | |
50-74K | 1295 (22%) | 4588 (17%) | 13907 (17%) | |
75-99K | 515 (8%) | 3011 (11%) | 9099 (11%) | |
100-199K | 654 (11%) | 6137 (23%) | 20494 (25%) | |
200K+ | 161 (2%) | 2631 (10%) | 8682 (10%) | |
Highest Education Level | No Diploma | 643 | 2542 | 8850 |
Diploma or GED | 1422 | 7153 | 25135 | |
Some College | 1871 | 9784 | 30726 | |
Assoc. Degree | 536 | 2859 | 10259 | |
Bachelors Degree | 1445 | 11474 | 35646 | |
Higher Degree | 1896 | 10848 | 31915 | |
Total Housing Units | 6,156 | 28,247 | 87,718 | |
--Owner-Occupied | 756 | 14,285 | 53,924 | |
--Renter-Occupied | 5,029 | 11,934 | 27,701 | |
Owner-Occupied Values | < 100K | 241 | 1304 | 10015 |
100-199K | 208 | 4092 | 14748 | |
200-299K | 135 | 3948 | 12423 | |
300-399K | 75 | 2185 | 6675 | |
400-499K | 35 | 1051 | 3337 | |
500K+ | 62 | 1705 | 6726 | |
Total Working Age Population | 9,086 | 50,411 | 162,808 | |
In Work Force | 5,708 | 30,380 | 102,124 | |
Not In Work Force | 3,379 | 20,031 | 60,684 | |
Workforce Employed | 5,386 | 28,759 | 96,301 | |
Workforce Unemployed | 322 | 1,621 | 5,805 | |
Civlian Workforce | 5,708 | 30,380 | 102,106 | |
Military Workforce | 0 | 0 | 18 | |
Total Households | 5,785 | 26,219 | 81,625 | |
Family Households | 2,152 | 14,929 | 50,303 | |
Non-Family Households | 3,633 | 11,290 | 31,322 | |
Married Couple | 1,174 | 10,872 | 36,703 | |
Other Family | 978 | 4,057 | 13,599 | |
Married w/Child | 326 | 3,630 | 13,667 | |
Single Male w/Child | 68 | 260 | 1,073 | |
Single Female w/Child | 484 | 1,427 | 4,589 |
Population Change Last Two Decades - Plus Projection
2000 | % | 2010 | % | 2020 | % | 2030 | |
---|---|---|---|---|---|---|---|
Michigan | 9,938,444 | -1 | 9,883,640 | +1 | 10,023,423 | +4 | 10,424,510 |
Oakland County | 1,194,156 | +1 | 1,202,362 | +5 | 1,264,515 | +7 | 1,350,052 |
Wayne County | 2,061,162 | -12 | 1,820,584 | -4 | 1,741,463 | -1 | 1,730,000 |
Total Working Age Population:
Total Households:
Total Working Age Population:
Total Households:
Total Working Age Population:
Total Households: