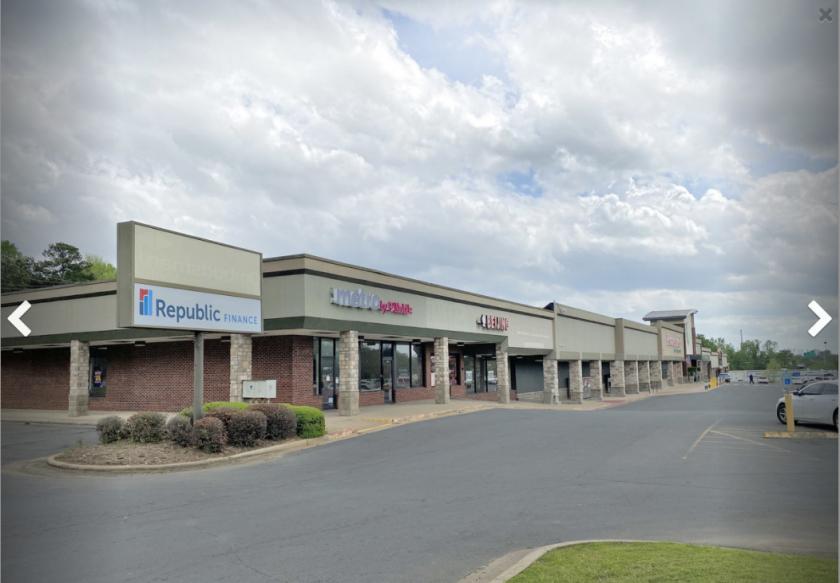
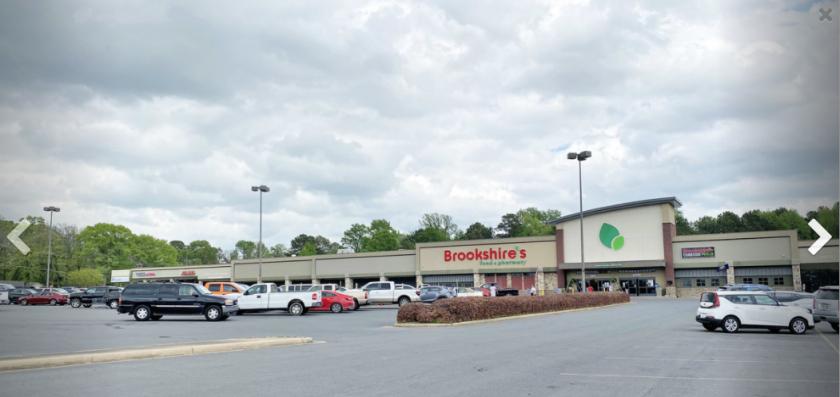
83,135 sq. ft. Retail Center
Anchored by Brookshire’s Food and Pharmacy
Conveniently located off I-220 and N. Market Street
Available Suite 15: 8,450 SF
Available Suite 25: 2,160 SF
Available Suite 35: 1,600 SF
Available Suite 45: 3,470 SF
Traffic Count: 41,648 Cars Daily
Generous Parking
Street and Store Front Signage Available
Zoning C-3
Lease Rate: $10-16 psf +$2.50 psf CAM charges
No part of this information may be copied, reproduced, repurposed, or screen-captured for any commercial purpose without prior written authorization from MyEListing.
While we strive to provide the most accurate information, all listing information, and demographic data, is provided by third-parties. As such, MyEListing will not be responsible for the accuracy of the information. It is strongly recommended that you verify all information with the listing agent, and any relevant agencies, prior to making any decisions.
What is the asking price for 3000 North Market Street in Shreveport?
The asking price for 3000 North Market Street is $10.00 - $16.00 a SF per Year
What is the building size of this commercial Retail property?
The size of this multi-unit property varies between 1600 - 8450 square feet
What kind of Retail is the propery at 3000 North Market Street?
The property at 3000 North Market Street Shreveport, LA 71107 is listed as a Shopping Center Retail property
What is the population within 1 mile of 3000 North Market Street in Shreveport?
The population within 1 mile of 3000 North Market Street Shreveport, LA 71107 is 2,443 people.
Who do I contact for questions about 3000 North Market Street?
You should contact the listing agent,
Brad Armstrong, for any details regarding this commercial listing.