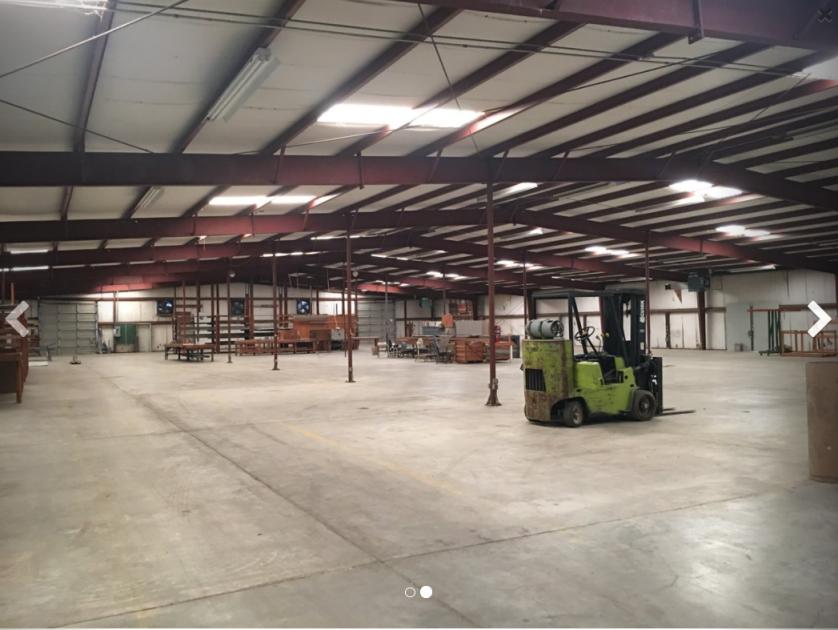
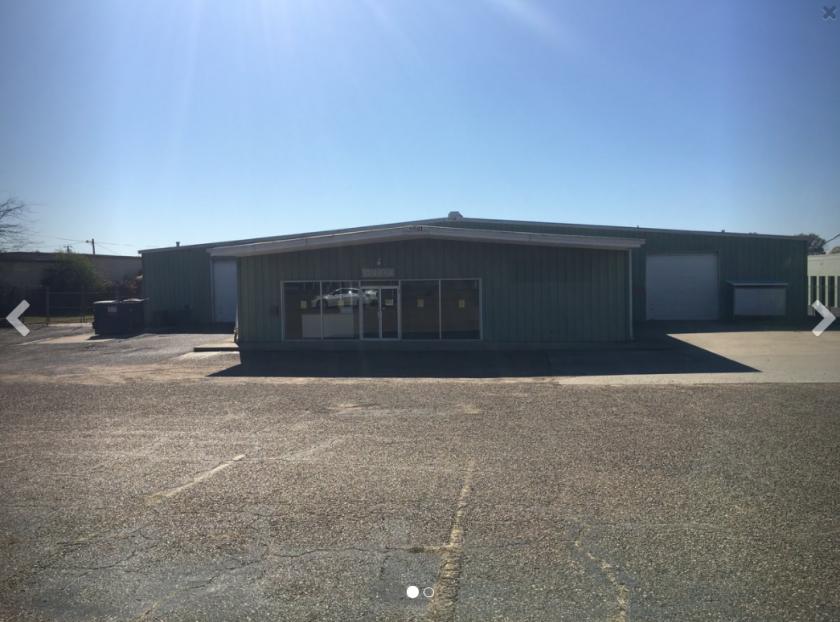
1-Mile | 3-Miles | 5-Miles | ||
---|---|---|---|---|
Total Population | 5,738 | 45,590 | 115,331 | |
Population Median Age | 36 | 37 | 38 | |
Population by Age | 0-9 Yrs | 925 (16%) | 6127 (13%) | 15429 (13%) |
10-19 Yrs | 744 (12%) | 6549 (14%) | 15619 (13%) | |
20-29 Yrs | 1000 (17%) | 7637 (16%) | 17331 (15%) | |
30-39 Yrs | 625 (10%) | 5713 (12%) | 15199 (13%) | |
40-49 Yrs | 582 (10%) | 4883 (10%) | 13189 (11%) | |
50-59 Yrs | 564 (9%) | 5480 (12%) | 14143 (12%) | |
60-69 Yrs | 794 (13%) | 5463 (11%) | 13448 (11%) | |
70+ Yrs | 505 (8%) | 3737 (8%) | 10972 (9%) | |
Median HH Income | $24,931 | $28,432 | $32,129 | |
Total Household Income | < 24K | 1129 (50%) | 7904 (45%) | 17997 (40%) |
25-49K | 598 (26%) | 4437 (25%) | 11425 (25%) | |
50-74K | 333 (14%) | 2664 (15%) | 6730 (15%) | |
75-99K | 145 (6%) | 1120 (6%) | 3427 (7%) | |
100-199K | 41 (1%) | 913 (5%) | 3736 (8%) | |
200K+ | 4 (0%) | 405 (2%) | 1398 (3%) | |
Highest Education Level | No Diploma | 853 | 5354 | 12072 |
Diploma or GED | 1324 | 11979 | 28097 | |
Some College | 530 | 5582 | 16164 | |
Assoc. Degree | 243 | 2292 | 5589 | |
Bachelors Degree | 343 | 2433 | 8481 | |
Higher Degree | 210 | 1755 | 5698 | |
Total Housing Units | 2,878 | 21,609 | 54,602 | |
--Owner-Occupied | 988 | 8,104 | 22,627 | |
--Renter-Occupied | 1,262 | 9,338 | 22,086 | |
Owner-Occupied Values | < 100K | 670 | 4915 | 9734 |
100-199K | 168 | 1865 | 7992 | |
200-299K | 53 | 704 | 2433 | |
300-399K | 81 | 398 | 1135 | |
400-499K | 0 | 53 | 364 | |
500K+ | 16 | 170 | 969 | |
Total Working Age Population | 4,296 | 35,064 | 89,904 | |
In Work Force | 2,301 | 19,969 | 51,212 | |
Not In Work Force | 1,995 | 15,094 | 38,691 | |
Workforce Employed | 1,940 | 17,708 | 46,587 | |
Workforce Unemployed | 361 | 2,126 | 4,222 | |
Civlian Workforce | 2,300 | 19,834 | 50,809 | |
Military Workforce | 1 | 135 | 403 | |
Total Households | 2,250 | 17,442 | 44,713 | |
Family Households | 1,318 | 10,212 | 26,324 | |
Non-Family Households | 932 | 7,230 | 18,390 | |
Married Couple | 461 | 4,483 | 13,704 | |
Other Family | 857 | 5,729 | 12,619 | |
Married w/Child | 115 | 1,309 | 4,555 | |
Single Male w/Child | 27 | 517 | 983 | |
Single Female w/Child | 417 | 2,162 | 5,141 |
Population Change Last Two Decades - Plus Projection
2000 | % | 2010 | % | 2020 | % | 2030 | |
---|---|---|---|---|---|---|---|
Louisiana | 4,468,976 | +1 | 4,533,372 | +1 | 4,588,310 | +5 | 4,813,420 |
Bossier Parish | 98,310 | +19 | 116,979 | +8 | 126,780 | +11 | 141,350 |
Caddo Parish | 252,161 | +1 | 254,969 | -6 | 240,880 | -4 | 231,790 |
Total Working Age Population:
Total Households:
Total Working Age Population:
Total Households:
Total Working Age Population:
Total Households: