Commercial Land
100-198 Perret Dr Slidell, LA 70461
100-198 Perret Dr Slidell, LA 70461
Details & Description
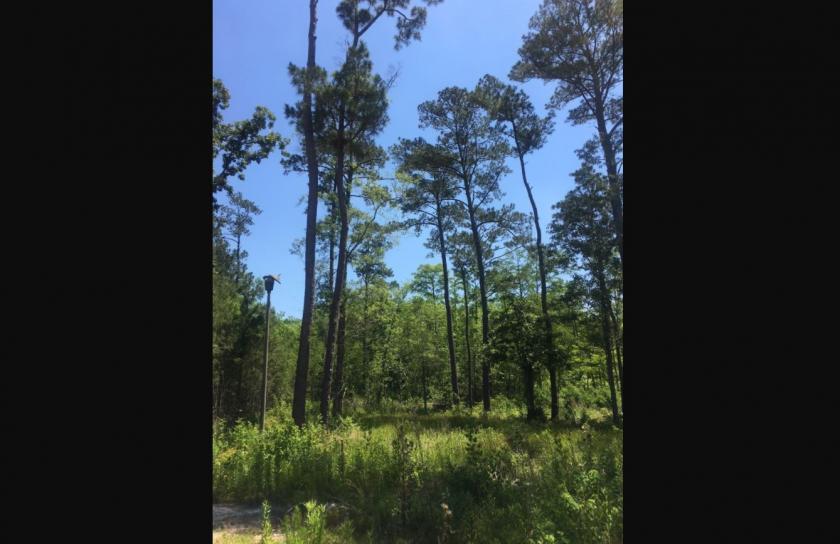
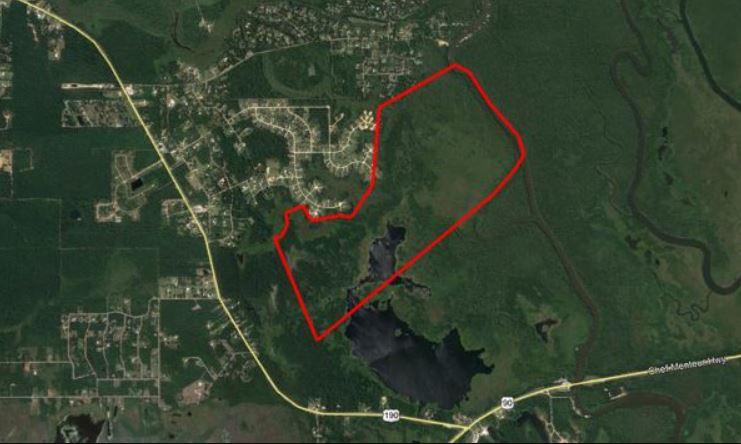
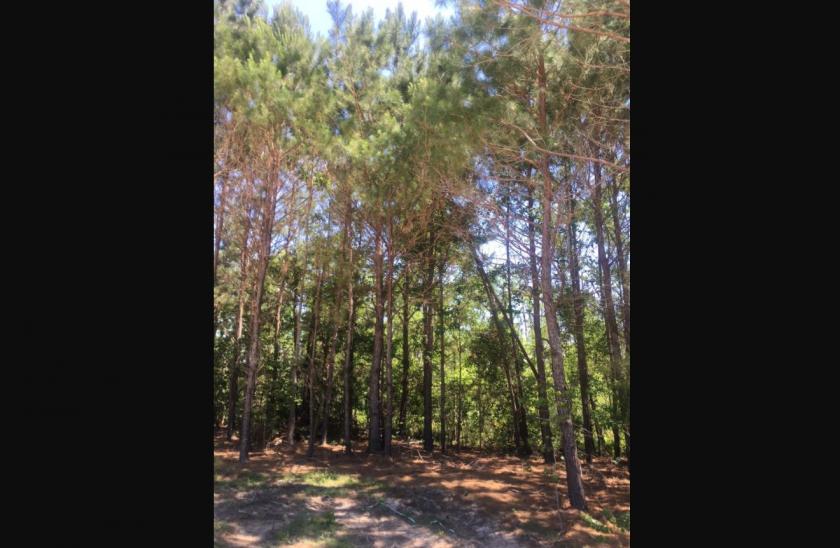
Additional Photos

Listing Agents

Pat Browne III
O: 504-274-2667
pat@mceneryco.com
O: 504-274-2667
pat@mceneryco.com
While we strive to provide the most accurate information, all listing information, and demographic data, is provided by third-parties. As such, MyEListing will not be responsible for the accuracy of the information. It is strongly recommended that you verify all information with the listing agent, and any relevant agencies, prior to making any decisions.


