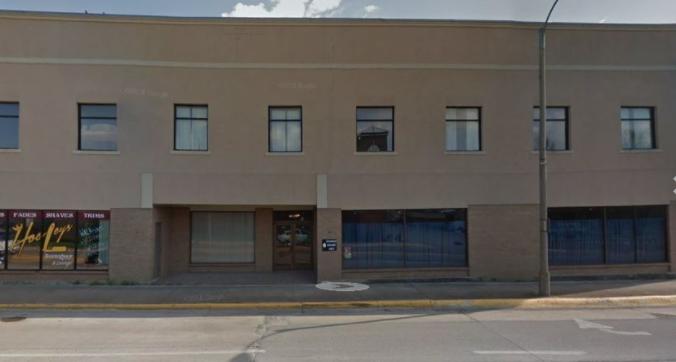
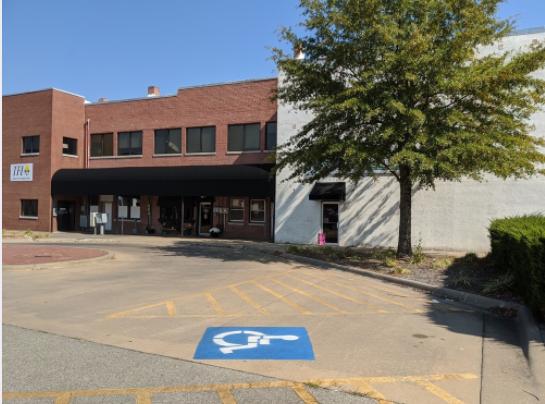
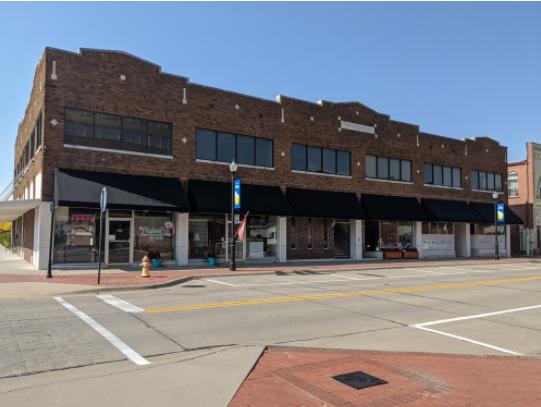
1-Mile | 3-Miles | 5-Miles | ||
---|---|---|---|---|
Total Population | 4,851 | 9,007 | 11,109 | |
Population Median Age | 37 | 38 | 40 | |
Population by Age | 0-9 Yrs | 701 (14%) | 1265 (14%) | 1429 (12%) |
10-19 Yrs | 725 (14%) | 1178 (13%) | 1385 (12%) | |
20-29 Yrs | 758 (15%) | 1286 (14%) | 1461 (13%) | |
30-39 Yrs | 647 (13%) | 1222 (13%) | 1432 (12%) | |
40-49 Yrs | 398 (8%) | 909 (10%) | 1208 (10%) | |
50-59 Yrs | 490 (10%) | 991 (11%) | 1350 (12%) | |
60-69 Yrs | 705 (14%) | 1232 (13%) | 1582 (14%) | |
70+ Yrs | 426 (8%) | 924 (10%) | 1262 (11%) | |
Median HH Income | $38,003 | $40,376 | $43,008 | |
Total Household Income | < 24K | 686 (33%) | 1185 (32%) | 1389 (30%) |
25-49K | 573 (28%) | 1004 (27%) | 1179 (25%) | |
50-74K | 424 (21%) | 793 (21%) | 1027 (22%) | |
75-99K | 183 (9%) | 369 (9%) | 490 (10%) | |
100-199K | 119 (5%) | 268 (7%) | 404 (8%) | |
200K+ | 33 (1%) | 77 (2%) | 119 (2%) | |
Highest Education Level | No Diploma | 354 | 641 | 763 |
Diploma or GED | 995 | 1925 | 2412 | |
Some College | 871 | 1692 | 2135 | |
Assoc. Degree | 301 | 608 | 783 | |
Bachelors Degree | 369 | 698 | 957 | |
Higher Degree | 223 | 406 | 556 | |
Total Housing Units | 2,642 | 4,734 | 5,842 | |
--Owner-Occupied | 1,141 | 2,240 | 2,949 | |
--Renter-Occupied | 878 | 1,457 | 1,659 | |
Owner-Occupied Values | < 100K | 935 | 1602 | 1872 |
100-199K | 180 | 472 | 765 | |
200-299K | 24 | 127 | 234 | |
300-399K | 1 | 22 | 44 | |
400-499K | 0 | 0 | 0 | |
500K+ | 1 | 16 | 35 | |
Total Working Age Population | 3,636 | 6,878 | 8,700 | |
In Work Force | 2,355 | 4,496 | 5,616 | |
Not In Work Force | 1,280 | 2,381 | 3,085 | |
Workforce Employed | 2,226 | 4,311 | 5,423 | |
Workforce Unemployed | 129 | 185 | 193 | |
Civlian Workforce | 2,355 | 4,496 | 5,616 | |
Military Workforce | 0 | 0 | 0 | |
Total Households | 2,019 | 3,697 | 4,608 | |
Family Households | 1,195 | 2,391 | 3,042 | |
Non-Family Households | 823 | 1,306 | 1,566 | |
Married Couple | 674 | 1,495 | 2,084 | |
Other Family | 521 | 896 | 958 | |
Married w/Child | 299 | 586 | 749 | |
Single Male w/Child | 43 | 92 | 93 | |
Single Female w/Child | 291 | 479 | 488 |
Population Change Last Two Decades - Plus Projection
2000 | % | 2010 | % | 2020 | % | 2030 | |
---|---|---|---|---|---|---|---|
Kansas | 2,688,418 | +6 | 2,853,118 | +5 | 2,988,194 | +5 | 3,140,008 |
Labette County | 22,835 | -5 | 21,607 | -5 | 20,529 | -6 | 19,313 |
Neosho County | 16,997 | -3 | 16,512 | -3 | 16,043 | -6 | 15,112 |
Total Working Age Population:
Total Households:
Total Working Age Population:
Total Households:
Total Working Age Population:
Total Households: