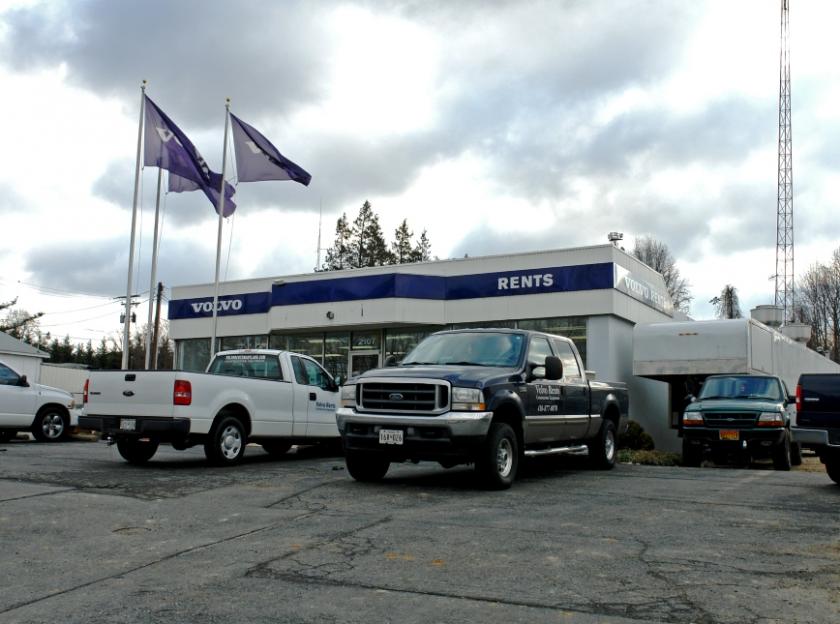
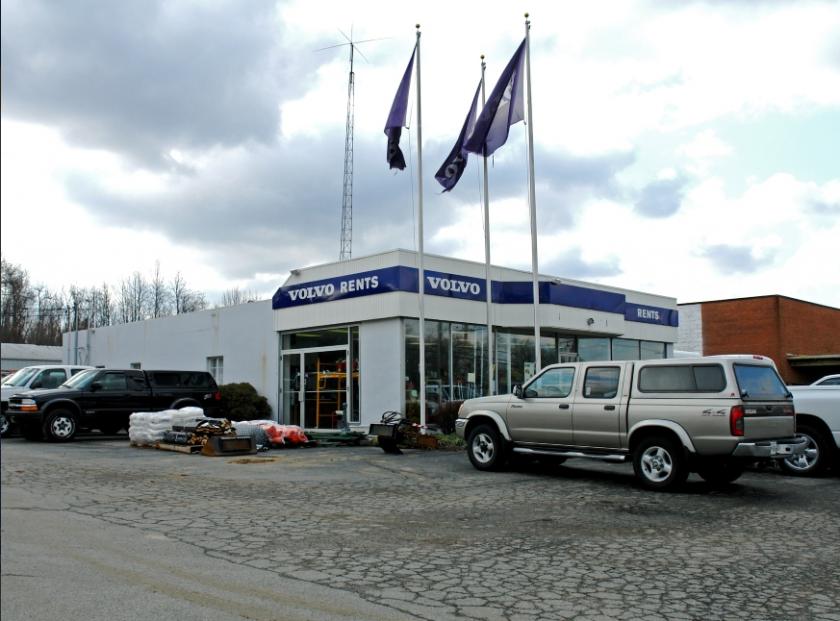
1-Mile | 3-Miles | 5-Miles | ||
---|---|---|---|---|
Total Population | 2,650 | 20,473 | 93,303 | |
Population Median Age | 42 | 43 | 41 | |
Population by Age | 0-9 Yrs | 206 (7%) | 2075 (10%) | 10454 (11%) |
10-19 Yrs | 485 (18%) | 2706 (13%) | 12081 (12%) | |
20-29 Yrs | 203 (7%) | 1884 (9%) | 10362 (11%) | |
30-39 Yrs | 207 (7%) | 2129 (10%) | 11480 (12%) | |
40-49 Yrs | 430 (16%) | 2626 (12%) | 12616 (13%) | |
50-59 Yrs | 407 (15%) | 3033 (14%) | 13617 (14%) | |
60-69 Yrs | 423 (15%) | 3079 (15%) | 11617 (12%) | |
70+ Yrs | 291 (10%) | 2941 (14%) | 11076 (11%) | |
Median HH Income | $113,500 | $105,238 | $94,733 | |
Total Household Income | < 24K | 67 (7%) | 837 (10%) | 3819 (10%) |
25-49K | 78 (8%) | 868 (11%) | 4875 (13%) | |
50-74K | 97 (10%) | 1013 (13%) | 5324 (14%) | |
75-99K | 120 (12%) | 937 (12%) | 4801 (13%) | |
100-199K | 441 (47%) | 2909 (37%) | 12487 (35%) | |
200K+ | 122 (13%) | 1130 (14%) | 4310 (12%) | |
Highest Education Level | No Diploma | 66 | 939 | 3664 |
Diploma or GED | 524 | 4145 | 16151 | |
Some College | 248 | 2396 | 12894 | |
Assoc. Degree | 125 | 1216 | 5854 | |
Bachelors Degree | 513 | 3481 | 16118 | |
Higher Degree | 354 | 2534 | 11312 | |
Total Housing Units | 955 | 8,098 | 37,151 | |
--Owner-Occupied | 879 | 6,786 | 28,977 | |
--Renter-Occupied | 46 | 907 | 6,639 | |
Owner-Occupied Values | < 100K | 2 | 75 | 691 |
100-199K | 14 | 473 | 3975 | |
200-299K | 101 | 1398 | 8807 | |
300-399K | 314 | 2298 | 7768 | |
400-499K | 327 | 1521 | 4754 | |
500K+ | 120 | 1022 | 2982 | |
Total Working Age Population | 2,167 | 16,764 | 75,459 | |
In Work Force | 1,448 | 10,785 | 50,653 | |
Not In Work Force | 720 | 5,979 | 24,806 | |
Workforce Employed | 1,392 | 10,341 | 48,626 | |
Workforce Unemployed | 44 | 402 | 1,811 | |
Civlian Workforce | 1,436 | 10,743 | 50,437 | |
Military Workforce | 12 | 42 | 215 | |
Total Households | 924 | 7,694 | 35,615 | |
Family Households | 751 | 5,869 | 25,419 | |
Non-Family Households | 173 | 1,824 | 10,196 | |
Married Couple | 667 | 5,064 | 21,109 | |
Other Family | 84 | 805 | 4,310 | |
Married w/Child | 271 | 1,768 | 8,562 | |
Single Male w/Child | 9 | 118 | 592 | |
Single Female w/Child | 39 | 327 | 1,618 |
Population Change Last Two Decades - Plus Projection
2000 | % | 2010 | % | 2020 | % | 2030 | |
---|---|---|---|---|---|---|---|
Maryland | 5,296,486 | +9 | 5,773,552 | +6 | 6,141,900 | +6 | 6,518,750 |
Baltimore County | 754,292 | +7 | 805,029 | +5 | 847,000 | +2 | 862,200 |
Harford County | 218,590 | +12 | 244,826 | +5 | 257,700 | +5 | 271,850 |
Total Working Age Population:
Total Households:
Total Working Age Population:
Total Households:
Total Working Age Population:
Total Households: