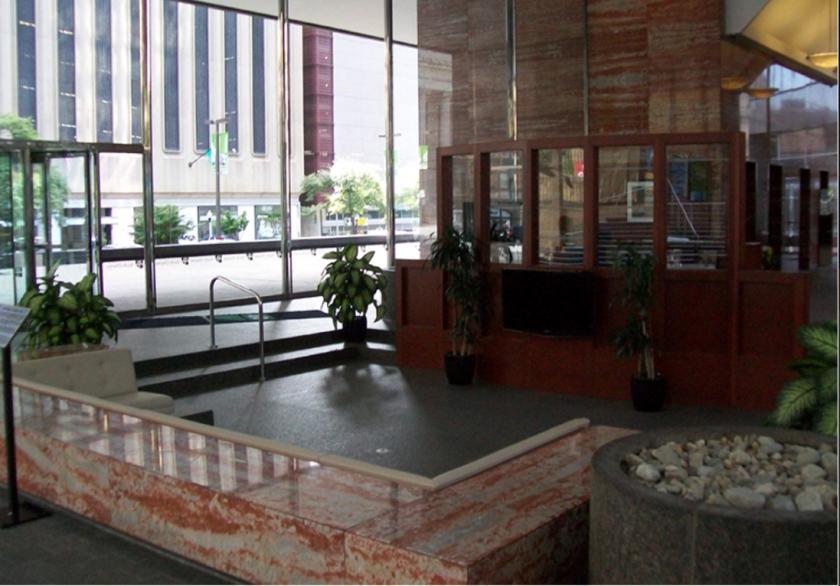
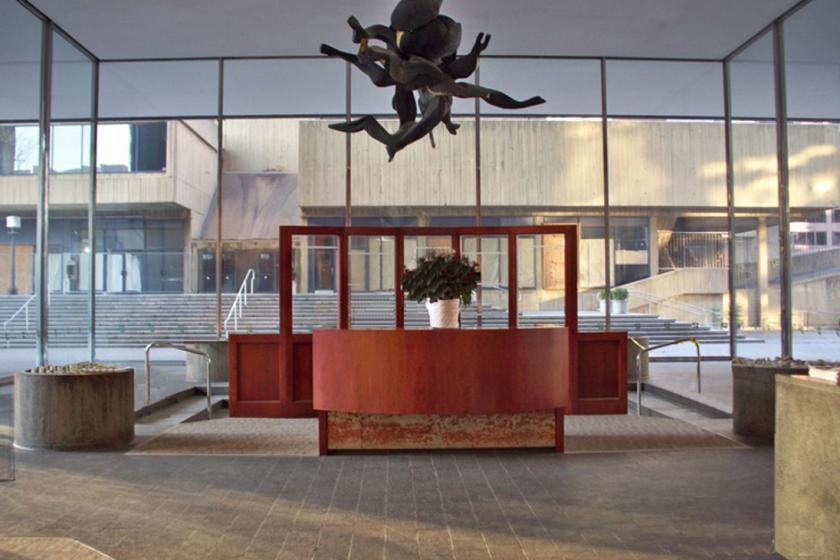
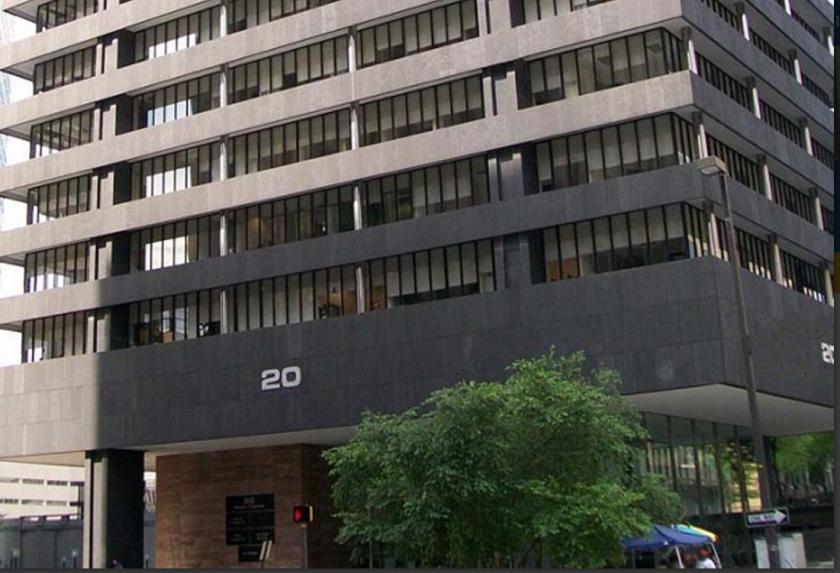
1-Mile | 3-Miles | 5-Miles | ||
---|---|---|---|---|
Total Population | 40,592 | 269,457 | 547,701 | |
Population Median Age | 36 | 36 | 37 | |
Population by Age | 0-9 Yrs | 2671 (6%) | 30489 (11%) | 66852 (12%) |
10-19 Yrs | 3036 (7%) | 26824 (9%) | 59531 (10%) | |
20-29 Yrs | 11821 (29%) | 55426 (20%) | 98429 (17%) | |
30-39 Yrs | 9073 (22%) | 51810 (19%) | 91958 (16%) | |
40-49 Yrs | 4105 (10%) | 28072 (10%) | 58793 (10%) | |
50-59 Yrs | 3900 (9%) | 32576 (12%) | 68537 (12%) | |
60-69 Yrs | 3643 (8%) | 25602 (9%) | 56876 (10%) | |
70+ Yrs | 2343 (5%) | 18658 (6%) | 46724 (8%) | |
Median HH Income | $56,266 | $51,571 | $50,627 | |
Total Household Income | < 24K | 5837 (30%) | 33254 (29%) | 59136 (27%) |
25-49K | 3182 (16%) | 21895 (19%) | 47669 (22%) | |
50-74K | 3130 (16%) | 16458 (14%) | 33873 (15%) | |
75-99K | 1830 (9%) | 10368 (9%) | 23060 (10%) | |
100-199K | 3453 (17%) | 20614 (18%) | 37816 (17%) | |
200K+ | 1858 (9%) | 9928 (8%) | 14037 (6%) | |
Highest Education Level | No Diploma | 3929 | 30330 | 59343 |
Diploma or GED | 5344 | 48404 | 112018 | |
Some College | 4450 | 30012 | 70658 | |
Assoc. Degree | 957 | 7639 | 17304 | |
Bachelors Degree | 8518 | 40655 | 64582 | |
Higher Degree | 7736 | 36196 | 57776 | |
Total Housing Units | 22,476 | 146,790 | 267,549 | |
--Owner-Occupied | 4,792 | 43,751 | 100,132 | |
--Renter-Occupied | 14,497 | 68,766 | 115,458 | |
Owner-Occupied Values | < 100K | 216 | 11980 | 25265 |
100-199K | 1120 | 8838 | 35285 | |
200-299K | 1113 | 9243 | 19362 | |
300-399K | 776 | 6017 | 8749 | |
400-499K | 510 | 3121 | 4483 | |
500K+ | 1057 | 4552 | 6988 | |
Total Working Age Population | 36,243 | 223,500 | 446,395 | |
In Work Force | 22,554 | 142,663 | 278,011 | |
Not In Work Force | 13,690 | 80,837 | 168,384 | |
Workforce Employed | 21,539 | 131,559 | 255,479 | |
Workforce Unemployed | 975 | 10,705 | 21,823 | |
Civlian Workforce | 22,514 | 142,264 | 277,302 | |
Military Workforce | 40 | 399 | 709 | |
Total Households | 19,289 | 112,517 | 215,589 | |
Family Households | 5,604 | 48,515 | 106,432 | |
Non-Family Households | 13,685 | 64,002 | 109,158 | |
Married Couple | 3,079 | 23,043 | 51,522 | |
Other Family | 2,526 | 25,472 | 54,910 | |
Married w/Child | 751 | 7,042 | 17,167 | |
Single Male w/Child | 132 | 2,032 | 4,298 | |
Single Female w/Child | 1,343 | 10,302 | 21,243 |
Population Change Last Two Decades - Plus Projection
2000 | % | 2010 | % | 2020 | % | 2030 | |
---|---|---|---|---|---|---|---|
Maryland | 5,296,486 | +9 | 5,773,552 | +6 | 6,141,900 | +6 | 6,518,750 |
Anne Arundel County | 489,656 | +10 | 537,656 | +7 | 573,250 | +4 | 596,700 |
Baltimore County | 754,292 | +7 | 805,029 | +5 | 847,000 | +2 | 862,200 |
Harford County | 218,590 | +12 | 244,826 | +5 | 257,700 | +5 | 271,850 |
Howard County | 247,842 | +16 | 287,085 | +17 | 336,900 | +9 | 366,800 |
Baltimore city | 651,154 | -5 | 620,961 | -1 | 616,300 | +1 | 625,100 |
Total Working Age Population:
Total Households:
Total Working Age Population:
Total Households:
Total Working Age Population:
Total Households: