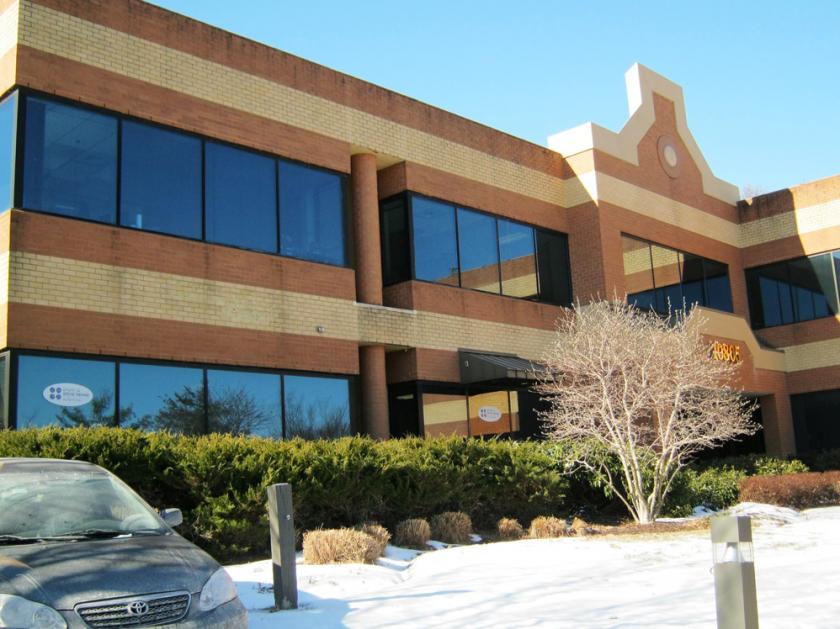
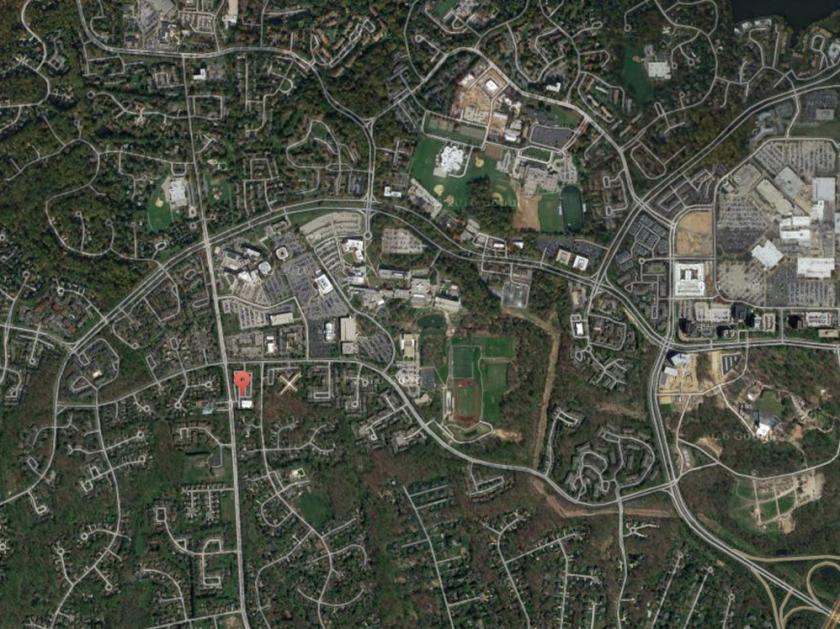
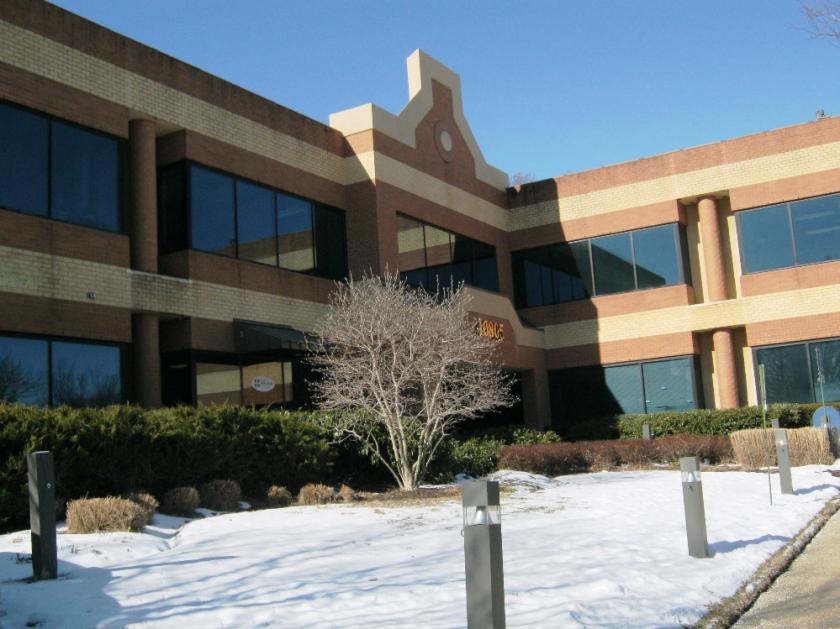
1-Mile | 3-Miles | 5-Miles | ||
---|---|---|---|---|
Total Population | 17,501 | 74,812 | 156,126 | |
Population Median Age | 38 | 40 | 39 | |
Population by Age | 0-9 Yrs | 1949 (11%) | 8312 (11%) | 18594 (11%) |
10-19 Yrs | 2525 (14%) | 9884 (13%) | 21324 (13%) | |
20-29 Yrs | 2282 (13%) | 9828 (13%) | 18529 (11%) | |
30-39 Yrs | 2663 (15%) | 9653 (12%) | 20000 (12%) | |
40-49 Yrs | 2525 (14%) | 10081 (13%) | 22474 (14%) | |
50-59 Yrs | 2409 (13%) | 10638 (14%) | 22395 (14%) | |
60-69 Yrs | 1594 (9%) | 8267 (11%) | 17704 (11%) | |
70+ Yrs | 1554 (8%) | 8147 (10%) | 15106 (9%) | |
Median HH Income | $97,469 | $113,450 | $121,763 | |
Total Household Income | < 24K | 953 (14%) | 2590 (9%) | 4698 (8%) |
25-49K | 781 (11%) | 2525 (8%) | 4589 (7%) | |
50-74K | 874 (12%) | 3308 (11%) | 6322 (10%) | |
75-99K | 876 (12%) | 4114 (14%) | 7518 (12%) | |
100-199K | 2514 (37%) | 10259 (35%) | 21670 (37%) | |
200K+ | 793 (11%) | 5888 (20%) | 13229 (22%) | |
Highest Education Level | No Diploma | 574 | 2412 | 4246 |
Diploma or GED | 1764 | 6311 | 12491 | |
Some College | 1814 | 7186 | 14824 | |
Assoc. Degree | 566 | 2719 | 5875 | |
Bachelors Degree | 3742 | 16757 | 33679 | |
Higher Degree | 3224 | 16804 | 36167 | |
Total Housing Units | 7,183 | 30,306 | 60,770 | |
--Owner-Occupied | 3,663 | 18,906 | 41,574 | |
--Renter-Occupied | 3,128 | 9,778 | 16,451 | |
Owner-Occupied Values | < 100K | 85 | 441 | 824 |
100-199K | 232 | 1105 | 2059 | |
200-299K | 867 | 3009 | 5797 | |
300-399K | 971 | 4508 | 9319 | |
400-499K | 726 | 3487 | 7718 | |
500K+ | 782 | 6355 | 15858 | |
Total Working Age Population | 14,050 | 60,654 | 124,152 | |
In Work Force | 10,362 | 43,040 | 88,713 | |
Not In Work Force | 3,687 | 17,615 | 35,440 | |
Workforce Employed | 9,744 | 40,982 | 84,475 | |
Workforce Unemployed | 479 | 1,594 | 3,361 | |
Civlian Workforce | 10,223 | 42,576 | 87,836 | |
Military Workforce | 140 | 463 | 877 | |
Total Households | 6,791 | 28,684 | 58,025 | |
Family Households | 4,460 | 19,491 | 41,147 | |
Non-Family Households | 2,331 | 9,193 | 16,879 | |
Married Couple | 2,728 | 14,810 | 32,196 | |
Other Family | 1,732 | 4,681 | 8,951 | |
Married w/Child | 1,083 | 6,032 | 14,392 | |
Single Male w/Child | 41 | 392 | 931 | |
Single Female w/Child | 901 | 1,982 | 3,566 |
Population Change Last Two Decades - Plus Projection
2000 | % | 2010 | % | 2020 | % | 2030 | |
---|---|---|---|---|---|---|---|
Maryland | 5,296,486 | +9 | 5,773,552 | +6 | 6,141,900 | +6 | 6,518,750 |
Anne Arundel County | 489,656 | +10 | 537,656 | +7 | 573,250 | +4 | 596,700 |
Baltimore County | 754,292 | +7 | 805,029 | +5 | 847,000 | +2 | 862,200 |
Howard County | 247,842 | +16 | 287,085 | +17 | 336,900 | +9 | 366,800 |
Montgomery County | 873,341 | +11 | 971,777 | +8 | 1,052,050 | +7 | 1,128,800 |
Total Working Age Population:
Total Households:
Total Working Age Population:
Total Households:
Total Working Age Population:
Total Households: