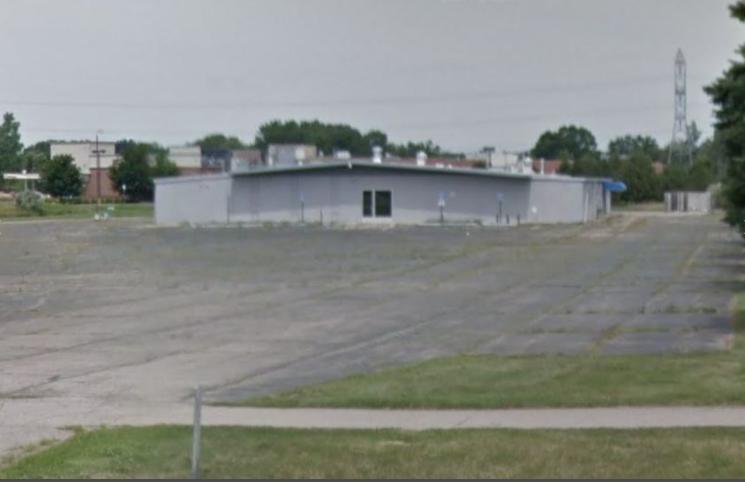
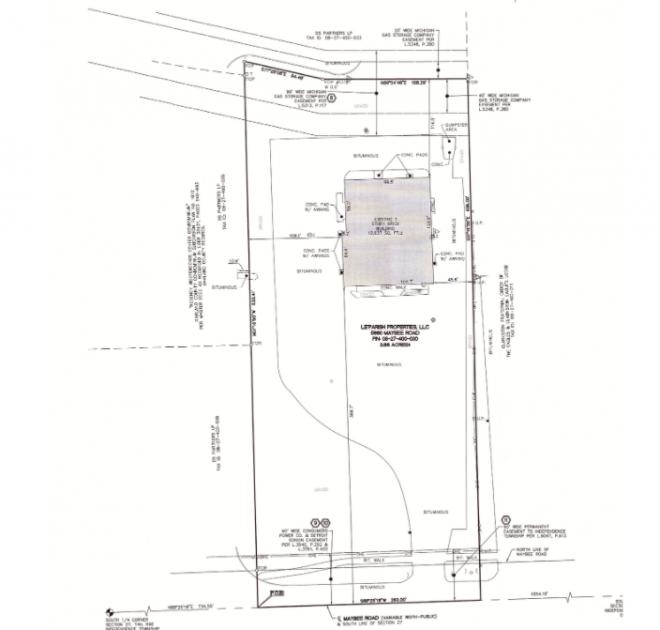
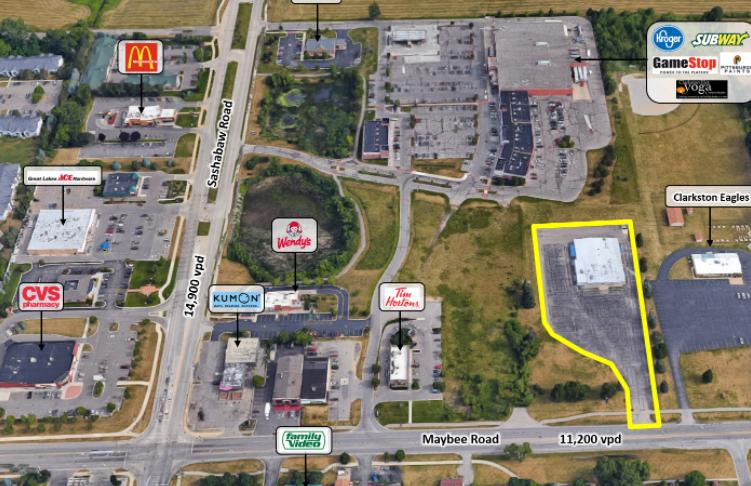
1-Mile | 3-Miles | 5-Miles | ||
---|---|---|---|---|
Total Population | 6,454 | 45,887 | 110,218 | |
Population Median Age | 38 | 41 | 40 | |
Population by Age | 0-9 Yrs | 636 (9%) | 4603 (10%) | 12467 (11%) |
10-19 Yrs | 869 (13%) | 5753 (12%) | 13720 (12%) | |
20-29 Yrs | 1116 (17%) | 6130 (13%) | 13831 (12%) | |
30-39 Yrs | 896 (13%) | 5534 (12%) | 12787 (11%) | |
40-49 Yrs | 735 (11%) | 5707 (12%) | 14242 (12%) | |
50-59 Yrs | 970 (15%) | 7641 (16%) | 17778 (16%) | |
60-69 Yrs | 674 (10%) | 5469 (11%) | 13491 (12%) | |
70+ Yrs | 556 (8%) | 5051 (11%) | 11902 (10%) | |
Median HH Income | $74,967 | $80,811 | $77,401 | |
Total Household Income | < 24K | 288 (11%) | 1851 (10%) | 5647 (12%) |
25-49K | 549 (21%) | 3505 (19%) | 8110 (18%) | |
50-74K | 435 (17%) | 3045 (16%) | 7374 (16%) | |
75-99K | 421 (16%) | 2779 (15%) | 6185 (14%) | |
100-199K | 735 (28%) | 5042 (27%) | 11966 (27%) | |
200K+ | 115 (4%) | 1872 (10%) | 4169 (9%) | |
Highest Education Level | No Diploma | 408 | 2334 | 5645 |
Diploma or GED | 947 | 6815 | 17428 | |
Some College | 1087 | 7748 | 17814 | |
Assoc. Degree | 572 | 3431 | 7599 | |
Bachelors Degree | 967 | 7730 | 18092 | |
Higher Degree | 383 | 4363 | 10493 | |
Total Housing Units | 2,788 | 19,198 | 46,643 | |
--Owner-Occupied | 1,579 | 14,263 | 33,686 | |
--Renter-Occupied | 964 | 3,831 | 9,765 | |
Owner-Occupied Values | < 100K | 91 | 1421 | 3677 |
100-199K | 635 | 5055 | 12346 | |
200-299K | 649 | 3978 | 8186 | |
300-399K | 123 | 1996 | 4607 | |
400-499K | 23 | 752 | 2083 | |
500K+ | 58 | 1060 | 2787 | |
Total Working Age Population | 5,403 | 38,056 | 89,639 | |
In Work Force | 3,868 | 25,637 | 59,128 | |
Not In Work Force | 1,535 | 12,419 | 30,511 | |
Workforce Employed | 3,622 | 24,602 | 56,528 | |
Workforce Unemployed | 246 | 1,009 | 2,528 | |
Civlian Workforce | 3,868 | 25,611 | 59,056 | |
Military Workforce | 0 | 26 | 71 | |
Total Households | 2,543 | 18,094 | 43,451 | |
Family Households | 1,809 | 12,660 | 29,366 | |
Non-Family Households | 734 | 5,435 | 14,085 | |
Married Couple | 1,072 | 9,708 | 22,506 | |
Other Family | 737 | 2,952 | 6,860 | |
Married w/Child | 341 | 3,390 | 8,306 | |
Single Male w/Child | 57 | 344 | 869 | |
Single Female w/Child | 271 | 1,027 | 2,402 |
Population Change Last Two Decades - Plus Projection
2000 | % | 2010 | % | 2020 | % | 2030 | |
---|---|---|---|---|---|---|---|
Michigan | 9,938,444 | -1 | 9,883,640 | +1 | 10,023,423 | +4 | 10,424,510 |
Oakland County | 1,194,156 | +1 | 1,202,362 | +5 | 1,264,515 | +7 | 1,350,052 |
Total Working Age Population:
Total Households:
Total Working Age Population:
Total Households:
Total Working Age Population:
Total Households: