Highlights
19,809 total square feet. Break down as follows:
- 3,600 sf (Retail)
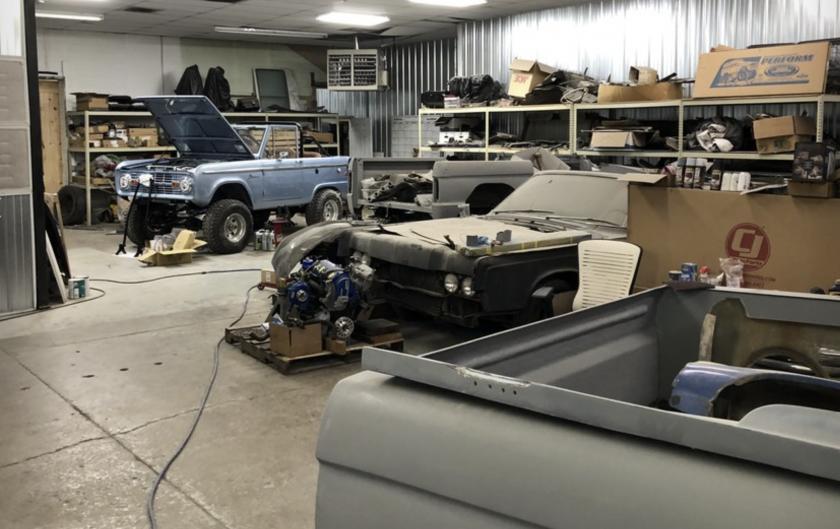
- 13,450 sf (Warehouse)
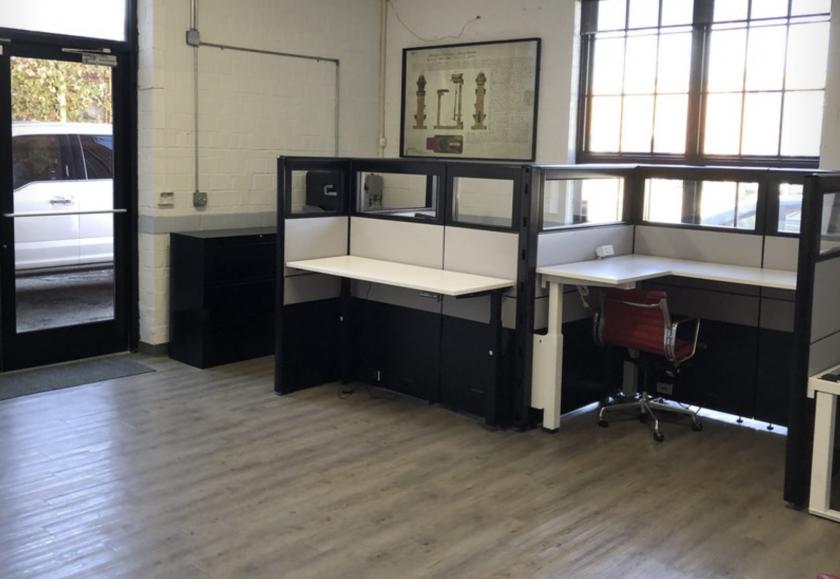
- 2,759 sf (Office)
Two story warehouse, fully remodeled offices and retail space
22' to 24' Clear
Three drive-in doors ( 14', 14' and 10')
Three phase electric
Entire site is .60 acres
23 on site parking spaces
All new windows (Pella) installed in warehouse and retail space
Roof and mechanicals are only four years old.
Three restrooms. (one handicap accessible in retail space)
Description
Commercial space of 3,600 SF leased at $26.60 /sf NNN ($8000/month). Lease expiration August 2027
Upon Sale seller will leaseback 16,209 sf at $4.80/sf NNN ($6500/month) for six months with an option to extend another six months.
Potential NOI is : $174,000
Property Taxes are currently $1.57/sf or $31,076.04
No part of this information may be copied, reproduced, repurposed, or screen-captured for any commercial purpose without prior written authorization from MyEListing.
While we strive to provide the most accurate information, all listing information, and demographic data, is provided by third-parties. As such, MyEListing will not be responsible for the accuracy of the information. It is strongly recommended that you verify all information with the listing agent, and any relevant agencies, prior to making any decisions.
What is the asking price for 1057 West 5th Avenue in Columbus?
The asking price for 1057 West 5th Avenue is $2,185,000
What is the building size of this Industrial property in Columbus, OH?
The size of the building/unit at 1057 West 5th Avenue in Columbus is 19,809 square feet
How much land does the Columbus, OH property at 1057 West 5th Avenue include?
1057 West 5th Avenue in Columbus includes 0.600 acres of land
What kind of Industrial is the propery at 1057 West 5th Avenue?
The property at 1057 West 5th Avenue Columbus, OH 43212 is listed as a Flex-Office-Warehouse Industrial property
What is the population within 1 mile of 1057 West 5th Avenue in Columbus?
The population within 1 mile of 1057 West 5th Avenue Columbus, OH 43212 is 18,365 people.
Who do I contact for questions about 1057 West 5th Avenue?
You should contact the listing agent,
Tim Treasure, for any details regarding this commercial listing.