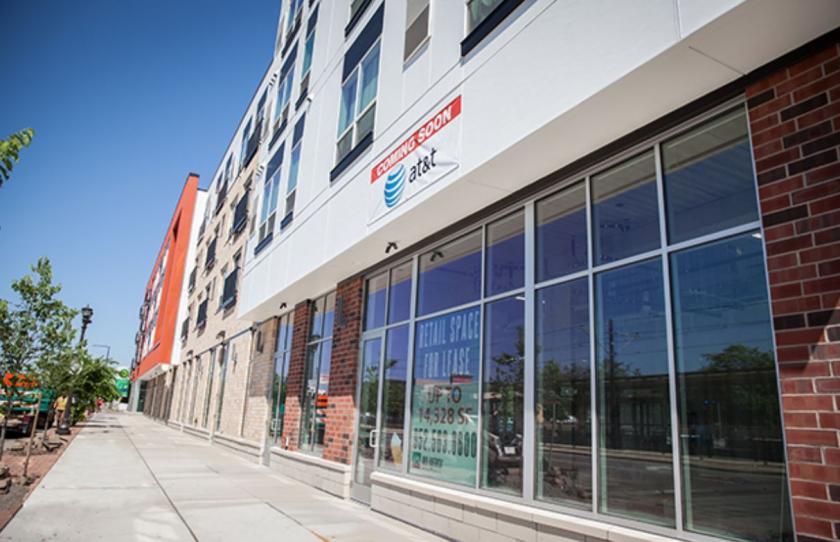
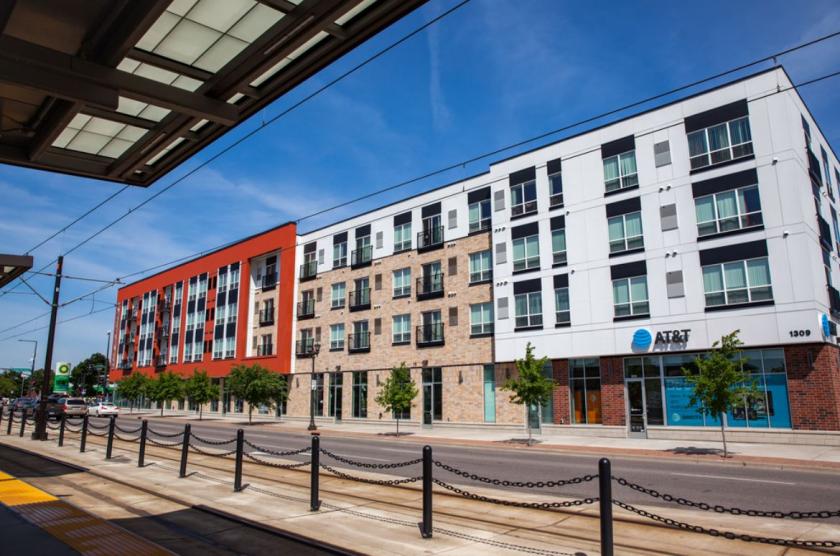
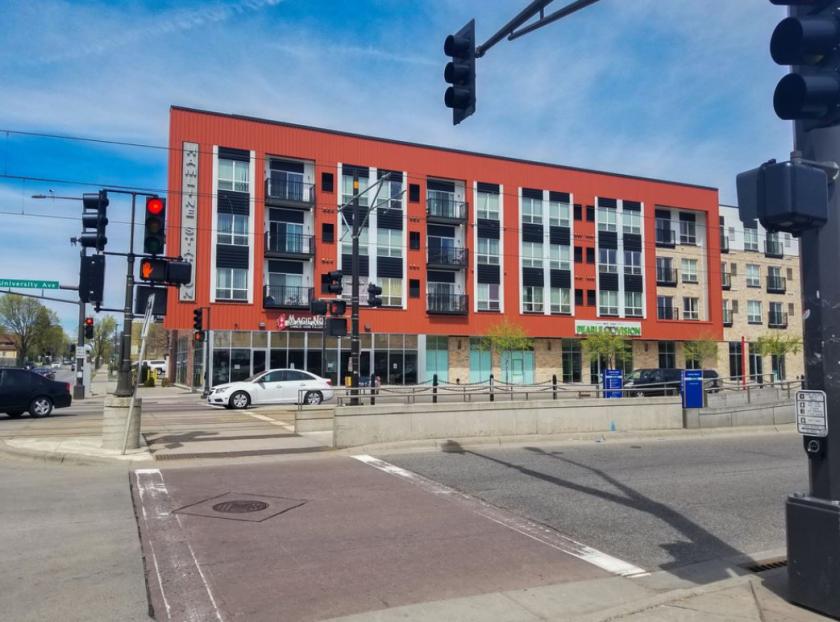
1-Mile | 3-Miles | 5-Miles | ||
---|---|---|---|---|
Total Population | 23,747 | 167,550 | 420,094 | |
Population Median Age | 33 | 36 | 35 | |
Population by Age | 0-9 Yrs | 2971 (12%) | 19625 (11%) | 52361 (12%) |
10-19 Yrs | 3542 (14%) | 21705 (12%) | 56238 (13%) | |
20-29 Yrs | 5262 (22%) | 31538 (18%) | 84623 (20%) | |
30-39 Yrs | 3823 (16%) | 26498 (15%) | 65246 (15%) | |
40-49 Yrs | 2636 (11%) | 18983 (11%) | 44280 (10%) | |
50-59 Yrs | 2510 (10%) | 19911 (11%) | 45562 (10%) | |
60-69 Yrs | 1968 (8%) | 17035 (10%) | 39931 (9%) | |
70+ Yrs | 1034 (4%) | 12253 (7%) | 31852 (7%) | |
Median HH Income | $61,874 | $67,225 | $60,335 | |
Total Household Income | < 24K | 1929 (22%) | 12739 (19%) | 35227 (21%) |
25-49K | 1676 (19%) | 12995 (19%) | 34731 (21%) | |
50-74K | 1538 (17%) | 11159 (16%) | 28269 (17%) | |
75-99K | 1415 (16%) | 8539 (12%) | 20730 (12%) | |
100-199K | 1842 (21%) | 15819 (23%) | 35182 (21%) | |
200K+ | 346 (3%) | 5675 (8%) | 10393 (6%) | |
Highest Education Level | No Diploma | 1474 | 9389 | 28107 |
Diploma or GED | 2716 | 16938 | 47829 | |
Some College | 2384 | 16721 | 44487 | |
Assoc. Degree | 1091 | 7429 | 19507 | |
Bachelors Degree | 3885 | 32969 | 73283 | |
Higher Degree | 2717 | 27240 | 54032 | |
Total Housing Units | 9,387 | 71,560 | 174,720 | |
--Owner-Occupied | 4,674 | 36,333 | 83,705 | |
--Renter-Occupied | 4,073 | 30,592 | 80,826 | |
Owner-Occupied Values | < 100K | 318 | 2101 | 5490 |
100-199K | 2031 | 9273 | 24959 | |
200-299K | 1621 | 11332 | 28353 | |
300-399K | 347 | 6507 | 12921 | |
400-499K | 189 | 3246 | 5455 | |
500K+ | 168 | 3873 | 6528 | |
Total Working Age Population | 18,905 | 135,832 | 340,215 | |
In Work Force | 14,077 | 97,508 | 238,914 | |
Not In Work Force | 4,828 | 38,324 | 101,301 | |
Workforce Employed | 13,427 | 93,338 | 226,573 | |
Workforce Unemployed | 648 | 4,150 | 12,248 | |
Civlian Workforce | 14,075 | 97,488 | 238,821 | |
Military Workforce | 1 | 20 | 93 | |
Total Households | 8,747 | 66,925 | 164,531 | |
Family Households | 4,504 | 34,517 | 83,460 | |
Non-Family Households | 4,243 | 32,408 | 81,072 | |
Married Couple | 2,962 | 25,913 | 58,582 | |
Other Family | 1,542 | 8,603 | 24,877 | |
Married w/Child | 1,421 | 11,252 | 24,999 | |
Single Male w/Child | 202 | 1,176 | 3,383 | |
Single Female w/Child | 713 | 3,886 | 11,192 |
Population Change Last Two Decades - Plus Projection
2000 | % | 2010 | % | 2020 | % | 2030 | |
---|---|---|---|---|---|---|---|
Minnesota | 4,919,479 | +8 | 5,303,925 | +7 | 5,687,161 | +5 | 5,974,304 |
Dakota County | 355,904 | +12 | 398,552 | +9 | 434,203 | +7 | 463,564 |
Hennepin County | 1,116,200 | +3 | 1,152,425 | +12 | 1,294,371 | +9 | 1,407,332 |
Ramsey County | 511,035 | 0 | 508,640 | +12 | 567,959 | +9 | 616,408 |
Total Working Age Population:
Total Households:
Total Working Age Population:
Total Households:
Total Working Age Population:
Total Households: