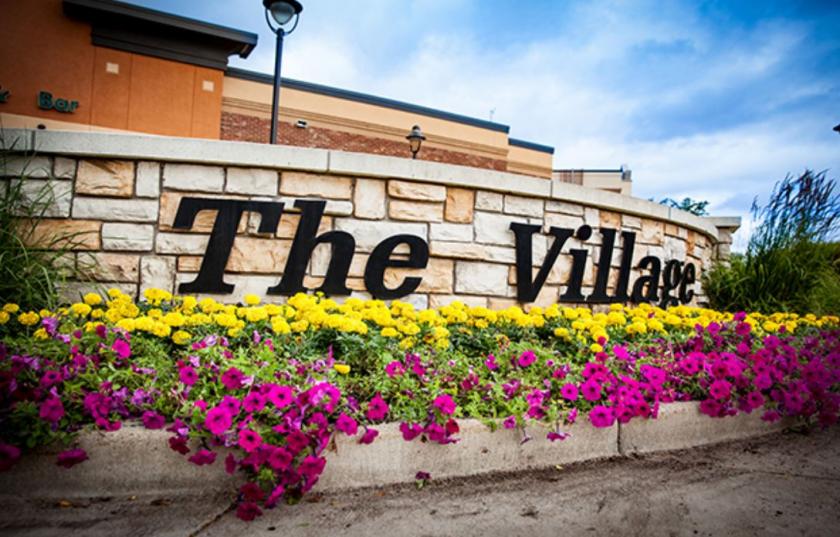
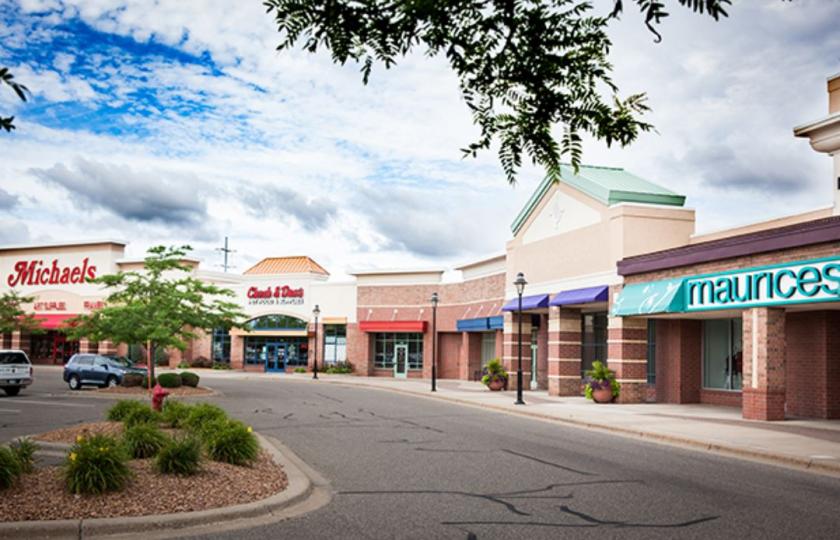
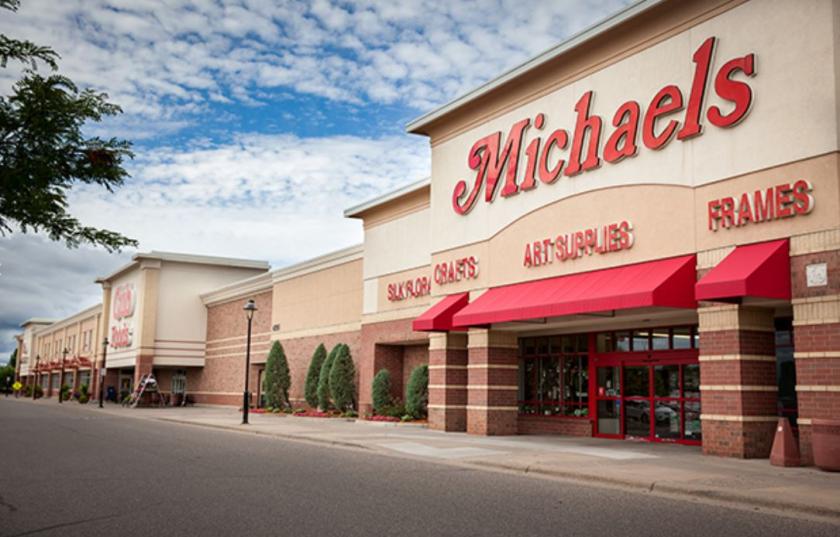
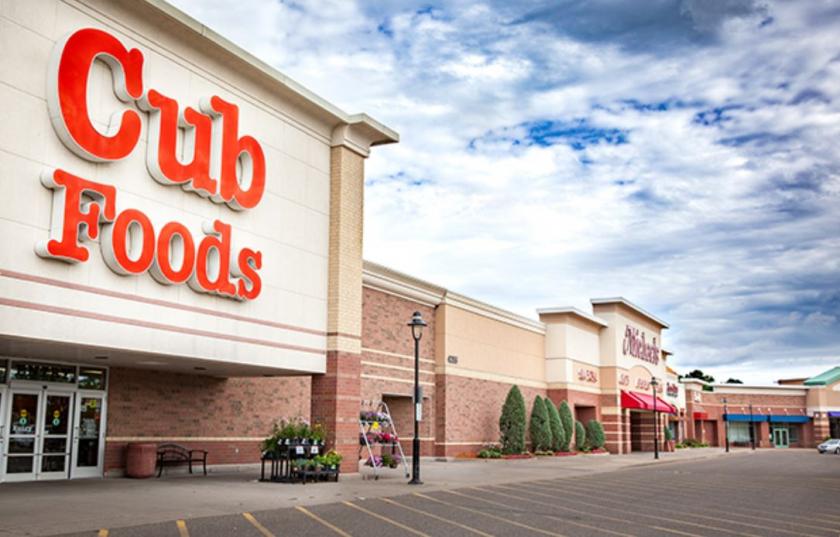
1-Mile | 3-Miles | 5-Miles | ||
---|---|---|---|---|
Total Population | 4,525 | 40,041 | 117,894 | |
Population Median Age | 34 | 38 | 38 | |
Population by Age | 0-9 Yrs | 750 (16%) | 4967 (12%) | 15476 (13%) |
10-19 Yrs | 701 (15%) | 5909 (14%) | 16977 (14%) | |
20-29 Yrs | 471 (10%) | 4144 (10%) | 12046 (10%) | |
30-39 Yrs | 764 (16%) | 5517 (13%) | 16108 (13%) | |
40-49 Yrs | 557 (12%) | 5541 (13%) | 16392 (13%) | |
50-59 Yrs | 641 (14%) | 6764 (16%) | 17874 (15%) | |
60-69 Yrs | 394 (8%) | 4647 (11%) | 13714 (11%) | |
70+ Yrs | 247 (5%) | 2552 (6%) | 9308 (7%) | |
Median HH Income | $85,483 | $96,698 | $90,269 | |
Total Household Income | < 24K | 112 (7%) | 1118 (7%) | 3995 (9%) |
25-49K | 344 (22%) | 1985 (13%) | 6498 (15%) | |
50-74K | 199 (12%) | 1984 (13%) | 6548 (15%) | |
75-99K | 300 (19%) | 2372 (16%) | 7113 (16%) | |
100-199K | 489 (31%) | 5062 (35%) | 14184 (33%) | |
200K+ | 118 (7%) | 1771 (12%) | 4433 (10%) | |
Highest Education Level | No Diploma | 120 | 1363 | 3980 |
Diploma or GED | 822 | 6117 | 18809 | |
Some College | 595 | 5467 | 15967 | |
Assoc. Degree | 496 | 3340 | 9477 | |
Bachelors Degree | 646 | 7448 | 21279 | |
Higher Degree | 208 | 3673 | 10328 | |
Total Housing Units | 1,600 | 14,694 | 44,050 | |
--Owner-Occupied | 1,352 | 12,324 | 36,609 | |
--Renter-Occupied | 210 | 1,969 | 6,162 | |
Owner-Occupied Values | < 100K | 56 | 1057 | 3015 |
100-199K | 420 | 2406 | 8683 | |
200-299K | 620 | 3921 | 12745 | |
300-399K | 108 | 2578 | 6590 | |
400-499K | 52 | 992 | 2673 | |
500K+ | 95 | 1370 | 2902 | |
Total Working Age Population | 3,317 | 31,406 | 91,666 | |
In Work Force | 2,484 | 22,219 | 65,617 | |
Not In Work Force | 833 | 9,187 | 26,049 | |
Workforce Employed | 2,368 | 21,553 | 63,428 | |
Workforce Unemployed | 105 | 628 | 2,102 | |
Civlian Workforce | 2,473 | 22,182 | 65,530 | |
Military Workforce | 11 | 38 | 87 | |
Total Households | 1,562 | 14,293 | 42,771 | |
Family Households | 1,226 | 10,634 | 31,220 | |
Non-Family Households | 336 | 3,659 | 11,551 | |
Married Couple | 935 | 8,746 | 25,260 | |
Other Family | 291 | 1,887 | 5,960 | |
Married w/Child | 419 | 3,895 | 11,194 | |
Single Male w/Child | 123 | 435 | 1,027 | |
Single Female w/Child | 68 | 693 | 2,349 |
Population Change Last Two Decades - Plus Projection
2000 | % | 2010 | % | 2020 | % | 2030 | |
---|---|---|---|---|---|---|---|
Minnesota | 4,919,479 | +8 | 5,303,925 | +7 | 5,687,161 | +5 | 5,974,304 |
Anoka County | 298,084 | +11 | 330,844 | +8 | 358,469 | +6 | 380,651 |
Hennepin County | 1,116,200 | +3 | 1,152,425 | +12 | 1,294,371 | +9 | 1,407,332 |
Ramsey County | 511,035 | 0 | 508,640 | +12 | 567,959 | +9 | 616,408 |
Total Working Age Population:
Total Households:
Total Working Age Population:
Total Households:
Total Working Age Population:
Total Households: