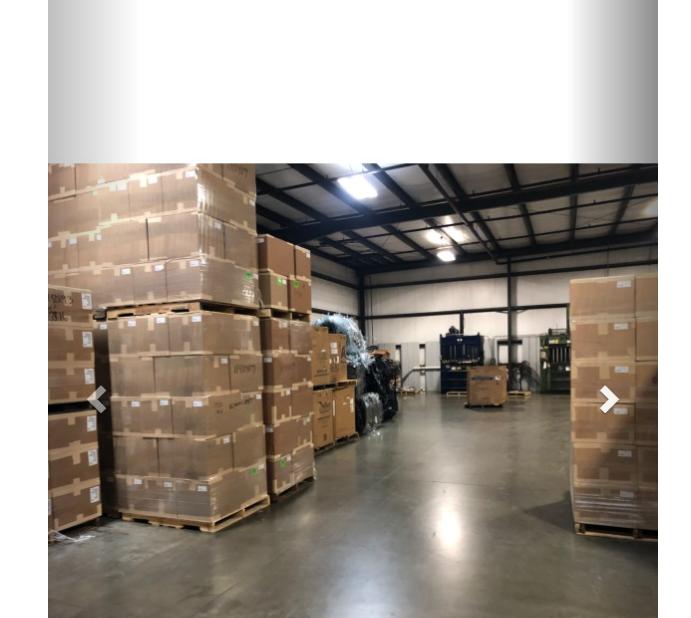
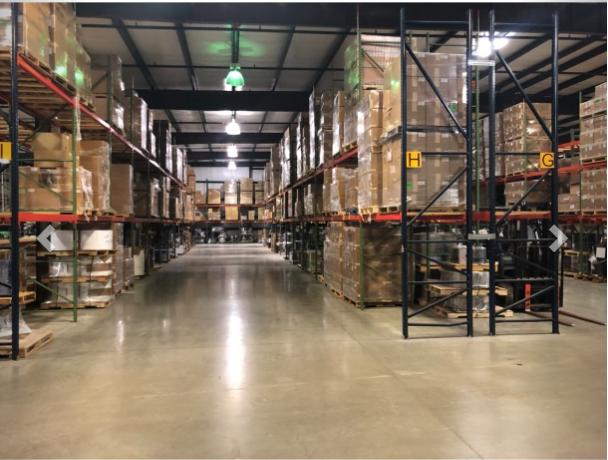
1-Mile | 3-Miles | 5-Miles | ||
---|---|---|---|---|
Total Population | 3,156 | 49,438 | 131,711 | |
Population Median Age | 38 | 39 | 39 | |
Population by Age | 0-9 Yrs | 536 (16%) | 6304 (12%) | 16381 (12%) |
10-19 Yrs | 395 (12%) | 6708 (13%) | 18292 (13%) | |
20-29 Yrs | 328 (10%) | 5045 (10%) | 14963 (11%) | |
30-39 Yrs | 465 (14%) | 6633 (13%) | 17522 (13%) | |
40-49 Yrs | 323 (10%) | 6963 (14%) | 18471 (14%) | |
50-59 Yrs | 400 (12%) | 7201 (14%) | 19314 (14%) | |
60-69 Yrs | 406 (12%) | 5904 (11%) | 14676 (11%) | |
70+ Yrs | 304 (9%) | 4679 (9%) | 12090 (9%) | |
Median HH Income | $78,213 | $92,412 | $91,536 | |
Total Household Income | < 24K | 264 (23%) | 1874 (10%) | 4924 (10%) |
25-49K | 141 (12%) | 2509 (13%) | 6822 (14%) | |
50-74K | 144 (12%) | 3029 (16%) | 7598 (16%) | |
75-99K | 166 (14%) | 2566 (13%) | 6286 (13%) | |
100-199K | 295 (25%) | 5925 (32%) | 15053 (32%) | |
200K+ | 131 (11%) | 2495 (13%) | 6321 (13%) | |
Highest Education Level | No Diploma | 196 | 2022 | 8125 |
Diploma or GED | 466 | 6179 | 17524 | |
Some College | 431 | 6377 | 17580 | |
Assoc. Degree | 168 | 2479 | 6614 | |
Bachelors Degree | 429 | 9844 | 24010 | |
Higher Degree | 354 | 6762 | 15292 | |
Total Housing Units | 1,217 | 19,360 | 49,063 | |
--Owner-Occupied | 768 | 13,811 | 34,798 | |
--Renter-Occupied | 373 | 4,585 | 12,208 | |
Owner-Occupied Values | < 100K | 0 | 168 | 941 |
100-199K | 177 | 2087 | 6513 | |
200-299K | 352 | 5253 | 12461 | |
300-399K | 157 | 3764 | 8445 | |
400-499K | 22 | 1380 | 3336 | |
500K+ | 60 | 1160 | 3102 | |
Total Working Age Population | 2,368 | 39,011 | 103,962 | |
In Work Force | 1,767 | 27,317 | 72,708 | |
Not In Work Force | 601 | 11,694 | 31,254 | |
Workforce Employed | 1,616 | 26,177 | 69,901 | |
Workforce Unemployed | 152 | 1,140 | 2,789 | |
Civlian Workforce | 1,767 | 27,317 | 72,690 | |
Military Workforce | 0 | 0 | 18 | |
Total Households | 1,141 | 18,396 | 47,005 | |
Family Households | 800 | 13,172 | 33,569 | |
Non-Family Households | 341 | 5,224 | 13,436 | |
Married Couple | 632 | 11,239 | 27,896 | |
Other Family | 168 | 1,933 | 5,673 | |
Married w/Child | 262 | 4,838 | 12,143 | |
Single Male w/Child | 8 | 191 | 785 | |
Single Female w/Child | 93 | 836 | 2,190 |
Population Change Last Two Decades - Plus Projection
2000 | % | 2010 | % | 2020 | % | 2030 | |
---|---|---|---|---|---|---|---|
Illinois | 12,419,293 | +3 | 12,830,632 | +12 | 14,316,487 | +6 | 15,138,849 |
Cook County | 5,376,741 | -3 | 5,194,675 | +10 | 5,707,832 | +5 | 5,990,243 |
DuPage County | 904,161 | +1 | 916,924 | +10 | 1,010,323 | +2 | 1,034,039 |
Kane County | 404,119 | +28 | 515,269 | +22 | 630,563 | +8 | 679,403 |
Total Working Age Population:
Total Households:
Total Working Age Population:
Total Households:
Total Working Age Population:
Total Households: