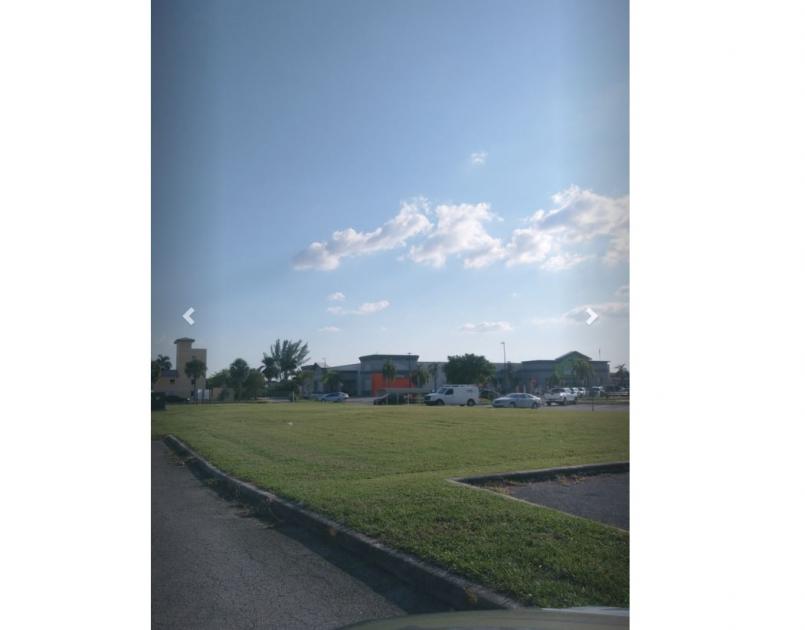
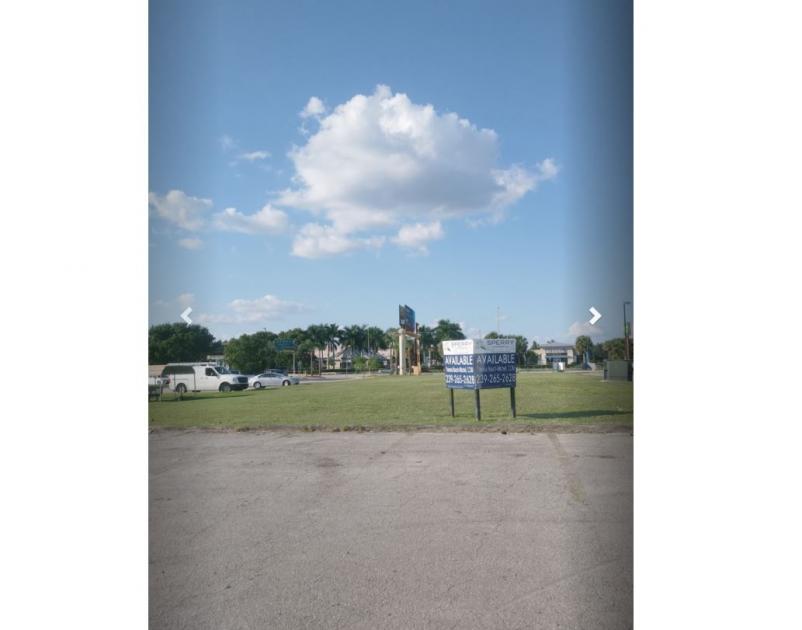
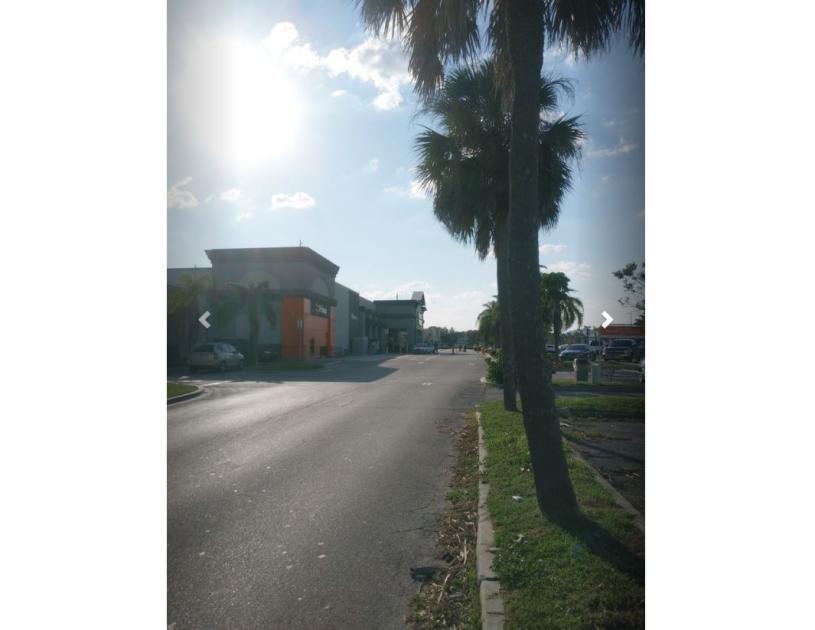
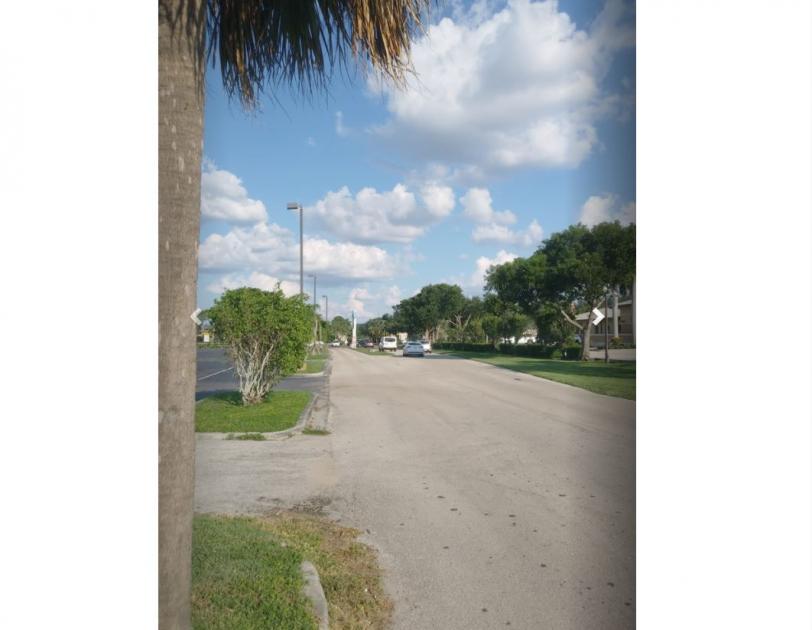
1-Mile | 3-Miles | 5-Miles | ||
---|---|---|---|---|
Total Population | 10,544 | 85,995 | 192,981 | |
Population Median Age | 51 | 51 | 50 | |
Population by Age | 0-9 Yrs | 562 (5%) | 6337 (7%) | 13765 (7%) |
10-19 Yrs | 864 (8%) | 6820 (7%) | 15868 (8%) | |
20-29 Yrs | 901 (8%) | 7524 (8%) | 16995 (8%) | |
30-39 Yrs | 1166 (11%) | 7873 (9%) | 18158 (9%) | |
40-49 Yrs | 968 (9%) | 8013 (9%) | 19573 (10%) | |
50-59 Yrs | 1273 (12%) | 10817 (12%) | 26410 (13%) | |
60-69 Yrs | 1758 (16%) | 15199 (17%) | 33261 (17%) | |
70+ Yrs | 3052 (28%) | 23412 (27%) | 48952 (25%) | |
Median HH Income | $56,071 | $55,284 | $56,568 | |
Total Household Income | < 24K | 879 (17%) | 7627 (20%) | 16111 (19%) |
25-49K | 1311 (26%) | 9609 (25%) | 20118 (24%) | |
50-74K | 1012 (20%) | 7220 (19%) | 15804 (19%) | |
75-99K | 721 (14%) | 4771 (12%) | 10434 (12%) | |
100-199K | 691 (14%) | 6120 (16%) | 14135 (17%) | |
200K+ | 279 (5%) | 2528 (6%) | 5971 (7%) | |
Highest Education Level | No Diploma | 611 | 5946 | 12951 |
Diploma or GED | 2148 | 18815 | 45463 | |
Some College | 1757 | 14327 | 31630 | |
Assoc. Degree | 775 | 7090 | 14955 | |
Bachelors Degree | 1965 | 14383 | 32043 | |
Higher Degree | 1368 | 9250 | 19201 | |
Total Housing Units | 6,583 | 56,441 | 121,216 | |
--Owner-Occupied | 3,381 | 26,524 | 58,591 | |
--Renter-Occupied | 1,512 | 11,351 | 23,982 | |
Owner-Occupied Values | < 100K | 511 | 2637 | 6022 |
100-199K | 1213 | 8233 | 16291 | |
200-299K | 599 | 6147 | 13922 | |
300-399K | 413 | 3378 | 8829 | |
400-499K | 239 | 2036 | 4562 | |
500K+ | 406 | 4093 | 8965 | |
Total Working Age Population | 9,529 | 75,283 | 169,531 | |
In Work Force | 4,977 | 36,814 | 86,065 | |
Not In Work Force | 4,552 | 38,469 | 83,466 | |
Workforce Employed | 4,777 | 34,901 | 81,955 | |
Workforce Unemployed | 200 | 1,634 | 3,816 | |
Civlian Workforce | 4,977 | 36,535 | 85,771 | |
Military Workforce | 0 | 279 | 294 | |
Total Households | 4,893 | 37,875 | 82,573 | |
Family Households | 2,610 | 21,657 | 48,657 | |
Non-Family Households | 2,282 | 16,218 | 33,916 | |
Married Couple | 1,962 | 17,346 | 39,335 | |
Other Family | 648 | 4,311 | 9,322 | |
Married w/Child | 322 | 3,244 | 7,969 | |
Single Male w/Child | 148 | 750 | 1,462 | |
Single Female w/Child | 213 | 1,239 | 2,802 |
Population Change Last Two Decades - Plus Projection
2000 | % | 2010 | % | 2020 | % | 2030 | |
---|---|---|---|---|---|---|---|
Florida | 15,982,378 | +18 | 18,801,310 | +14 | 21,517,610 | +13 | 24,340,457 |
Collier County | 251,377 | +28 | 321,520 | +19 | 382,826 | +17 | 449,537 |
Lee County | 440,888 | +40 | 618,754 | +21 | 747,388 | +19 | 892,108 |
Total Working Age Population:
Total Households:
Total Working Age Population:
Total Households:
Total Working Age Population:
Total Households: