Highlights
Shop space available including fully equipped second generation restaurant space and freestanding outlot
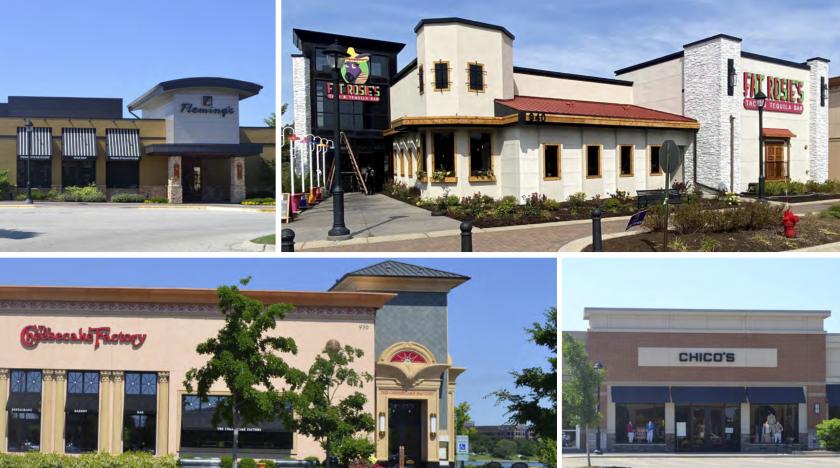
Shopping Center features a mix of full service & quick serve restaurants, fashion, and convenience based retailers
Adjacent to 444 Social luxury residential building with 300 units
Surrounding area features 14 fortune 500 companies including Walgreens Boots Alliance, Allstate, Mondelez International, CDW and Baxter International
Located just south of Lincolnshire Corporate Center business park with ±10,000 employees
Shadow anchored by Regal/IMAX Theater which draws an average of 15,000 visitors per week and NorthShore Medical Group with an estimated 300-450 patients per day
All information based on the most recently available data (updated annually) and is provided in 1-mile, 3-mile, and 5-mile radii (radiuses) of the property location.
1-Mile | 3-Miles | 5-Miles | ||
---|---|---|---|---|
Total Population | 3,669 | 59,822 | 180,164 | |
Population Median Age | 48 | 41 | 41 | |
Population by Age | 0-9 Yrs | 348 (9%) | 6682 (11%) | 21371 (11%) |
10-19 Yrs | 282 (7%) | 8071 (13%) | 23846 (13%) | |
20-29 Yrs | 395 (10%) | 5924 (9%) | 17180 (9%) | |
30-39 Yrs | 440 (11%) | 7640 (12%) | 22225 (12%) | |
40-49 Yrs | 412 (11%) | 8504 (14%) | 25615 (14%) | |
50-59 Yrs | 424 (11%) | 8545 (14%) | 25911 (14%) | |
60-69 Yrs | 216 (5%) | 7179 (12%) | 22784 (12%) | |
70+ Yrs | 1152 (31%) | 7276 (12%) | 21232 (11%) | |
Median HH Income | $93,966 | $110,010 | $104,433 | |
Total Household Income | < 24K | 229 (14%) | 2390 (10%) | 6728 (10%) |
25-49K | 181 (11%) | 2781 (12%) | 8969 (13%) | |
50-74K | 189 (11%) | 2272 (10%) | 8608 (12%) | |
75-99K | 267 (16%) | 2664 (12%) | 7961 (11%) | |
100-199K | 435 (27%) | 6626 (30%) | 19993 (29%) | |
200K+ | 301 (18%) | 5332 (24%) | 14723 (21%) | |
Highest Education Level | No Diploma | 84 | 2218 | 7490 |
Diploma or GED | 276 | 5753 | 17771 | |
Some College | 420 | 5547 | 18172 | |
Assoc. Degree | 213 | 2028 | 6749 | |
Bachelors Degree | 1063 | 14346 | 42429 | |
Higher Degree | 754 | 12145 | 33952 | |
Total Housing Units | 1,727 | 23,214 | 70,719 | |
--Owner-Occupied | 988 | 16,358 | 50,087 | |
--Renter-Occupied | 615 | 5,709 | 16,894 | |
Owner-Occupied Values | < 100K | 10 | 919 | 2463 |
100-199K | 57 | 1915 | 7427 | |
200-299K | 126 | 2740 | 8472 | |
300-399K | 211 | 3194 | 9931 | |
400-499K | 267 | 2630 | 7014 | |
500K+ | 317 | 4960 | 14780 | |
Total Working Age Population | 3,155 | 48,240 | 143,823 | |
In Work Force | 1,552 | 33,340 | 97,263 | |
Not In Work Force | 1,603 | 14,900 | 46,561 | |
Workforce Employed | 1,467 | 31,726 | 93,495 | |
Workforce Unemployed | 84 | 1,606 | 3,724 | |
Civlian Workforce | 1,552 | 33,333 | 97,219 | |
Military Workforce | 0 | 7 | 43 | |
Total Households | 1,602 | 22,066 | 66,981 | |
Family Households | 882 | 16,160 | 48,890 | |
Non-Family Households | 721 | 5,906 | 18,091 | |
Married Couple | 778 | 14,018 | 42,001 | |
Other Family | 104 | 2,142 | 6,889 | |
Married w/Child | 333 | 6,433 | 18,624 | |
Single Male w/Child | 8 | 243 | 809 | |
Single Female w/Child | 32 | 788 | 2,535 |
Population Change Last Two Decades - Plus Projection
2000 | % | 2010 | % | 2020 | % | 2030 | |
---|---|---|---|---|---|---|---|
Illinois | 12,419,293 | +3 | 12,830,632 | +12 | 14,316,487 | +6 | 15,138,849 |
Cook County | 5,376,741 | -3 | 5,194,675 | +10 | 5,707,832 | +5 | 5,990,243 |
Lake County | 644,356 | +9 | 703,462 | +17 | 820,250 | +6 | 873,024 |
No part of this information may be copied, reproduced, repurposed, or screen-captured for any commercial purpose without prior written authorization from MyEListing.
While we strive to provide the most accurate information, all listing information, and demographic data, is provided by third-parties. As such, MyEListing will not be responsible for the accuracy of the information. It is strongly recommended that you verify all information with the listing agent, and any relevant agencies, prior to making any decisions.